Introduction
The COVID-19 crisis that hit the world and the United States has resulted in profound changes to our way of life. While this paper focuses on workers and economic effects, we note that the crisis is foremost one of a pandemic. The economic situation is a byproduct. There have been significant differences in countries’ policy responses to the pandemic, which in turn have led to important disparate economic outcomes. It is clear the U.S. Federal government’s abdication of responsibility in responding to the crisis has left far too many in peril, both economically and healthwise. The absence of a coherent national strategy has exposed and exacerbated long-standing racial and economic inequalities—again, both economically and healthwise. Fits and starts of economic activity continue to have feedback loops with the evolution of the virus. Public policy and investment will largely determine our rates of sickness, death and economic pain.
It also warrants early emphasis that information contained in this paper of the profound economic devastation wrought by COVID-19 is neither a call for immediate business reopenings nor stimulus spending as traditionally understood. Comparing the current economic crisis with the Great Recession or any other contemporary recession shows that this crisis is categorically different. While attempts to return quickly to “business as usual” may have been desirable in previous downturns, employing such a strategy in the midst of a pandemic is more likely to be marked by mass death than by sustained economic inroads.
Looking back at the economic recovery following the Great Recession, we see a prolonged period of sluggish growth and weak labor markets; it is clear that stimulus efforts did not go far enough as California endured 44 straight months of double-digit unemployment. The ideal approach to the current crisis, however, may ironically be a slow-recovery path—yet one with additional government relief programs that are large, sustained, flexible, and perhaps even radical, reflecting the gravity of the situation. Relief, more akin to economic survival packages, should keep families as close to whole as possible throughout the pandemic. Additionally, for those who remained on the job as well as those returning to work, enforceable mandated safety regulations are warranted, including workplace grievance procedures and safely boards that include worker voice; this is especially critical for the majority of workers who are not represented by unions.
The coronavirus-induced downturn is not a recession per se, but instead is an economy intentionally stunted as a precaution against sickness and death. Maintaining a degree of economic suspended animation is required if we are to gain control of the pandemic to a degree that, in turn, will allow a safer return of the economy. This will require large and ongoing amounts of government spending. The country is struggling with the question of whether the shutdown is worth the economic damage. It is worth asking, however, if avoidable loss of life is an acceptable cost of returning to the status quo—especially in a country with vast wealth and means to avert such suffering. We move to our economic analyses of the workforce with deep acknowledgment and gratitude to all of the workers who have sacrificed, and continue to sacrifice, so much in the face of this crisis.
Highlights
- The Golden State shed over 2.6 million jobs early in the pandemic (March and April combined) before initial reopening gains of 692,400 jobs in total for May and June—leaving an 11.0% shortfall, larger than the 8.3% gap at the height of job losses over the Great Recession.
- Employment in California’s public sector is short by nearly 345,000 workers. This would be a challenge in normal times but may be catastrophic when the need for public servants is critical for the state to have the necessary workforce to address the ongoing crisis. The U.S. Congress must provide aid to cash-strapped states.
- California is struggling as virus hot spots hamper openings. An increasing number of additional claims—representing reopened claims after a claimant temporary returned to work—has driven the steady rise in initial UI claims since May 17. In the week ending July 25th, 57% of regular initial UI were reopened claims.
- Continued UI claims measure the number of workers who are actively receiving benefits. Californians filed 6.6 million continued UI claims for the week ending July 18; regular UI accounted for 47.7% of these, while 48.5 were filed under the PUA program (covering workers typically not covered by UI) and 3.8% were filed under the PEUC (13-week extension) program.
- All UI programs have paid out approximately $460 billion in total across the U.S. (March-July 2020). During the week ending July 18, one in five workers (31.3 million) in the U.S. benefited from some form of UI payment. One in four workers in California have benefited from UI relief totaling $55 billion (March-July).
- More relief from the Federal government is necessary to keep families in their homes and economically secure. The median weekly UI benefit provided by the state of California (March 15 to July 25) was $339, far short of 50% of California’s median family income. The extra $600 provided by the federal government brought the total to just above 50% of MFI.
- Many families are struggling with income losses during this crisis, with people of color disproportionately affected. Since mid-March, 64.8% of Latinx and 55.6% of Black households in California reported a loss of employment income, compared to just under half of White households.
- The cost of not acting boldly to provide widespread economic security is unacceptable during a regular recession (mass unemployment is never the fault of workers), but this is not a regular recession and the failure of leadership from the top means this pandemic-led recession could turn into a depression.
The Shutdown
The federal government never ordered a nationwide closure, leaving it to state and/or local officials to decide. On March 19, 2020, California was the first to order a statewide shutdown. Economic and other activities came to a halt as schools closed and all non-essential work, unless performed remotely, stopped. The patchwork of state and local economic shutdowns, along with the individual decision of many to remain homebound due to risk and uncertainty, amounted to a stark retrenchment of economic activity.
Figure 1 shows the collapse in consumer spending in the U.S. and California from the Opportunity Insights Economic Tracker.1 Opportunity Insights aggregates high frequency, granular level data from private companies to provide daily statistics on consumer spending, business revenues, employment rates, and other key indicators. The drop actually started near the end of February as word of the virus spread. Compared to January, overall consumer spending contracted in mid-April by a third in the U.S. and 37% in California. This picture correlates with the 5% economic contraction recorded in the U.S. for the first quarter of the year, followed by a 33% contraction in the second quarter (on an annual basis). Spending in California continues to be lower than the U.S. overall, likely due to early, strict, and widespread curtailment of economic activity.
Industry specific spending mirrored what many of us experienced (see link in footnote #1 to explore Opportunity Insights data). Early on, spending at grocery stores skyrocketed due to uncertainty. In mid-March, spending on groceries spiked nearly 74% and 95% in the U.S. and California, respectively. Grocery spending in the Golden State has since moderated to about 18% above pre-virus trends. Conversely, spending at hotels and restaurants plummeted nearly 67% in the U.Sa. and 71% in California at its mid-March trough. By the first week in July, after reopening to some degree, spending in hotels and restaurants rebounded but were still down by a third and 45%, respectively in the U.S. and California.
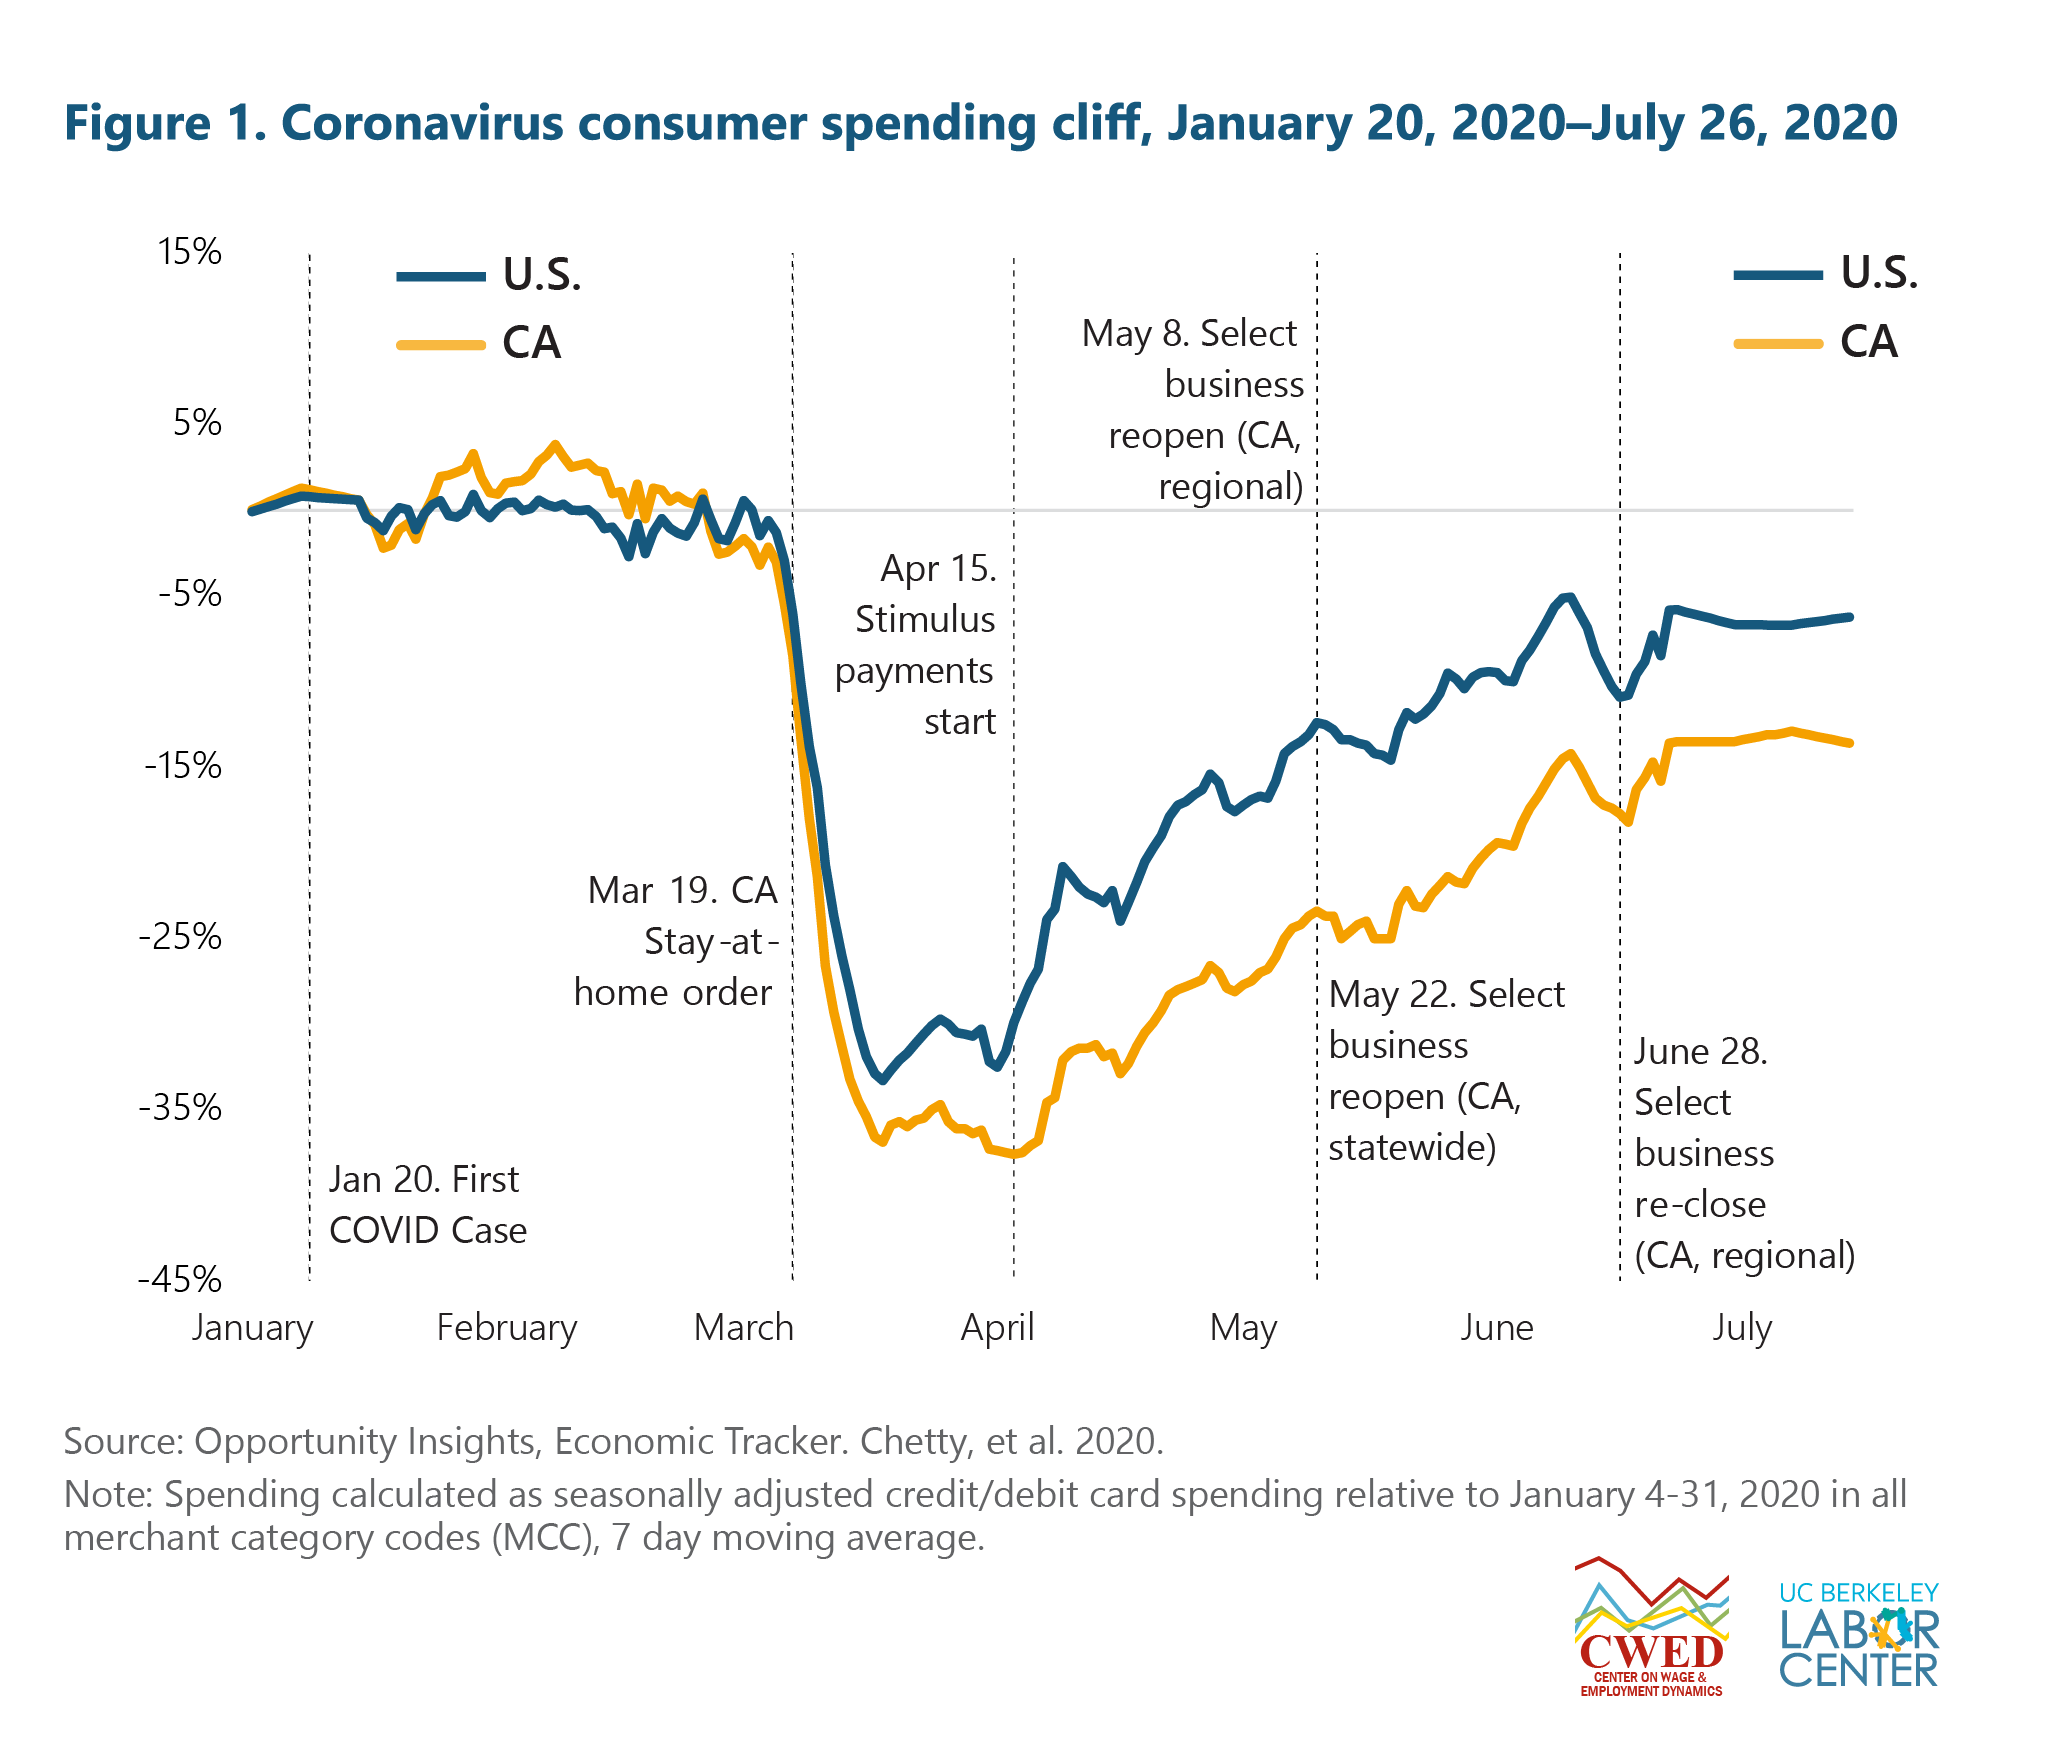
As Figure 1 shows, consumer spending started to pick up especially after relief payments started in mid-April. Also shown is the June 28 regional re-closure order in California—that also happened to various degrees across the country. Expect volatility in spending and consumer confidence to continue as delayed openings and/or re-closings accompany upticks in the virus and hamper prospects for a sustained economic rebound. Also important is the fact that much of the relief in the CARES Act is running out, which may be reflected in the recent stalls in spending improvement in the U.S. and California.
Unemployment Insurance (UI) Claims
The purposeful halt of economic activity meant that suddenly tens of millions of workers were sent home to shelter in place. For many, remote employment was not possible. The first official data to reveal the historic exodus from the labor market came with the release of initial unemployment insurance (UI) claims from the Department of Labor—stunningly illustrated in Figure 2.2
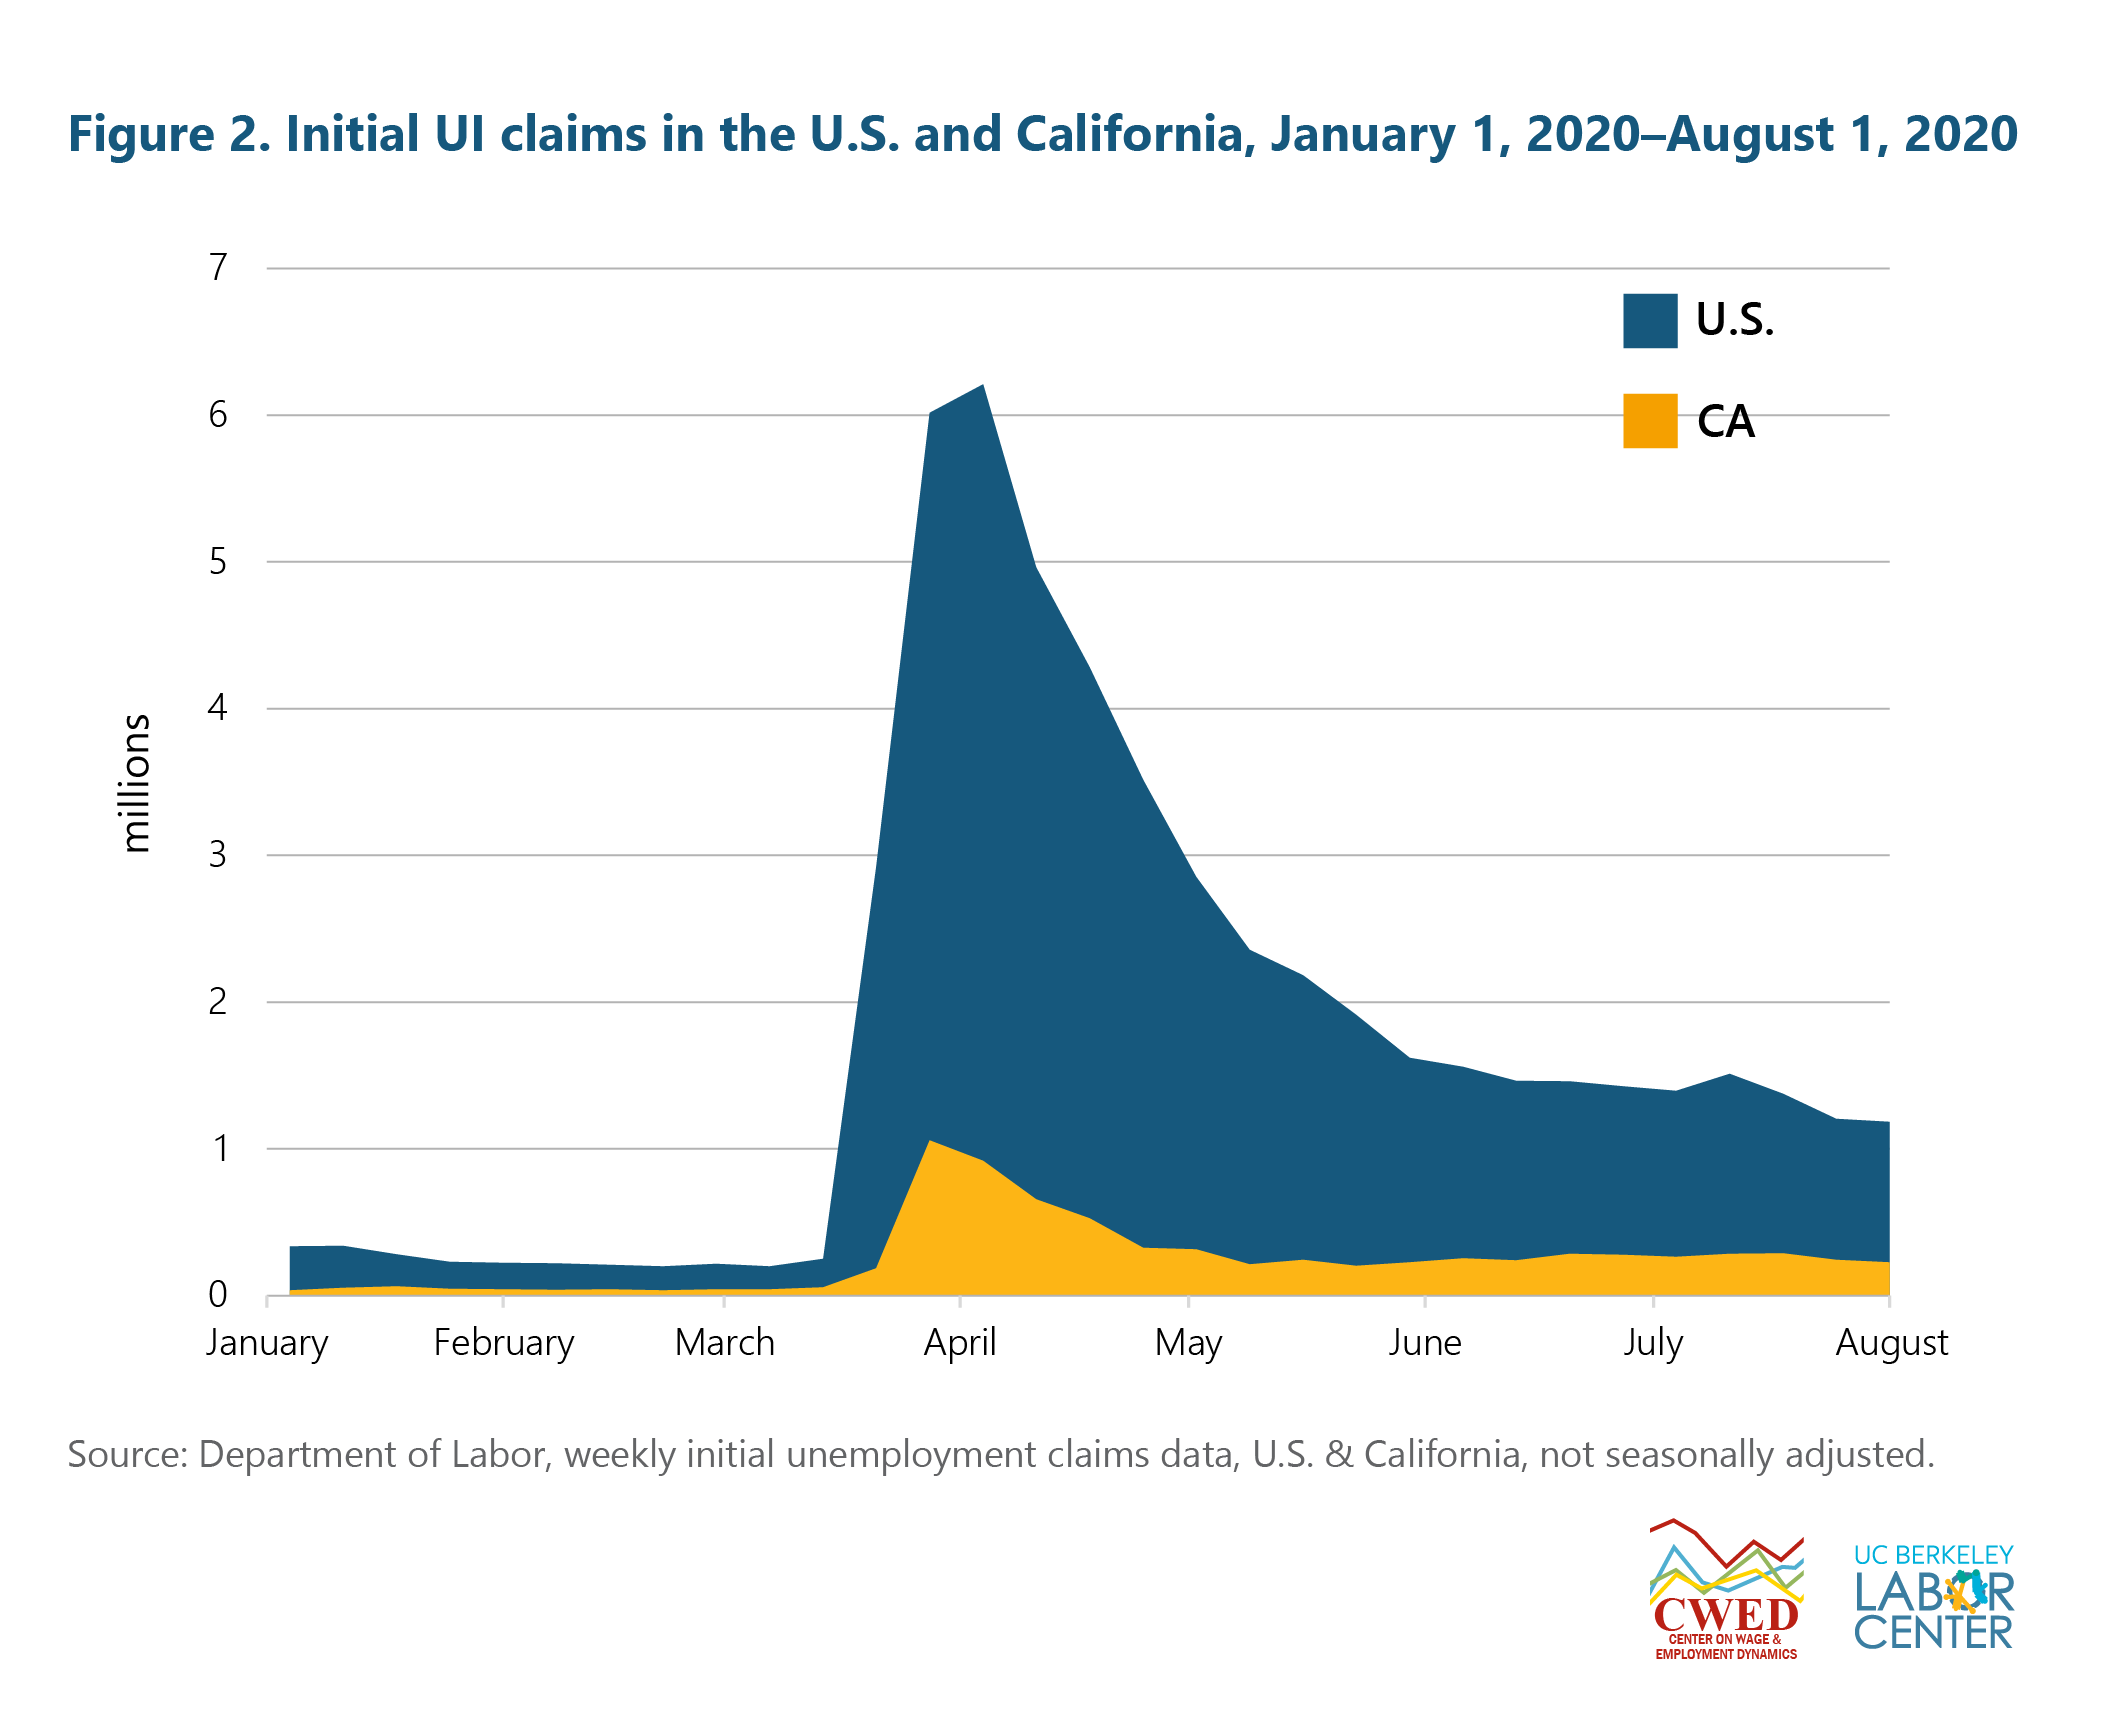
U.S. claims shot up to over 2.9 million the week of March 21, compared to 251,000 the previous week—jobless workers submitted another 6 million claims the following week. The state UI systems, funded and staffed based on the previous year’s low unemployment rates, struggled to handle the unprecedented demand. The historic influx of claims overwhelmed state systems and likely moderated initial spikes. The well over one million initial claims filed over the last 20 straight weeks in the U.S. is indicative of continued economic woes.
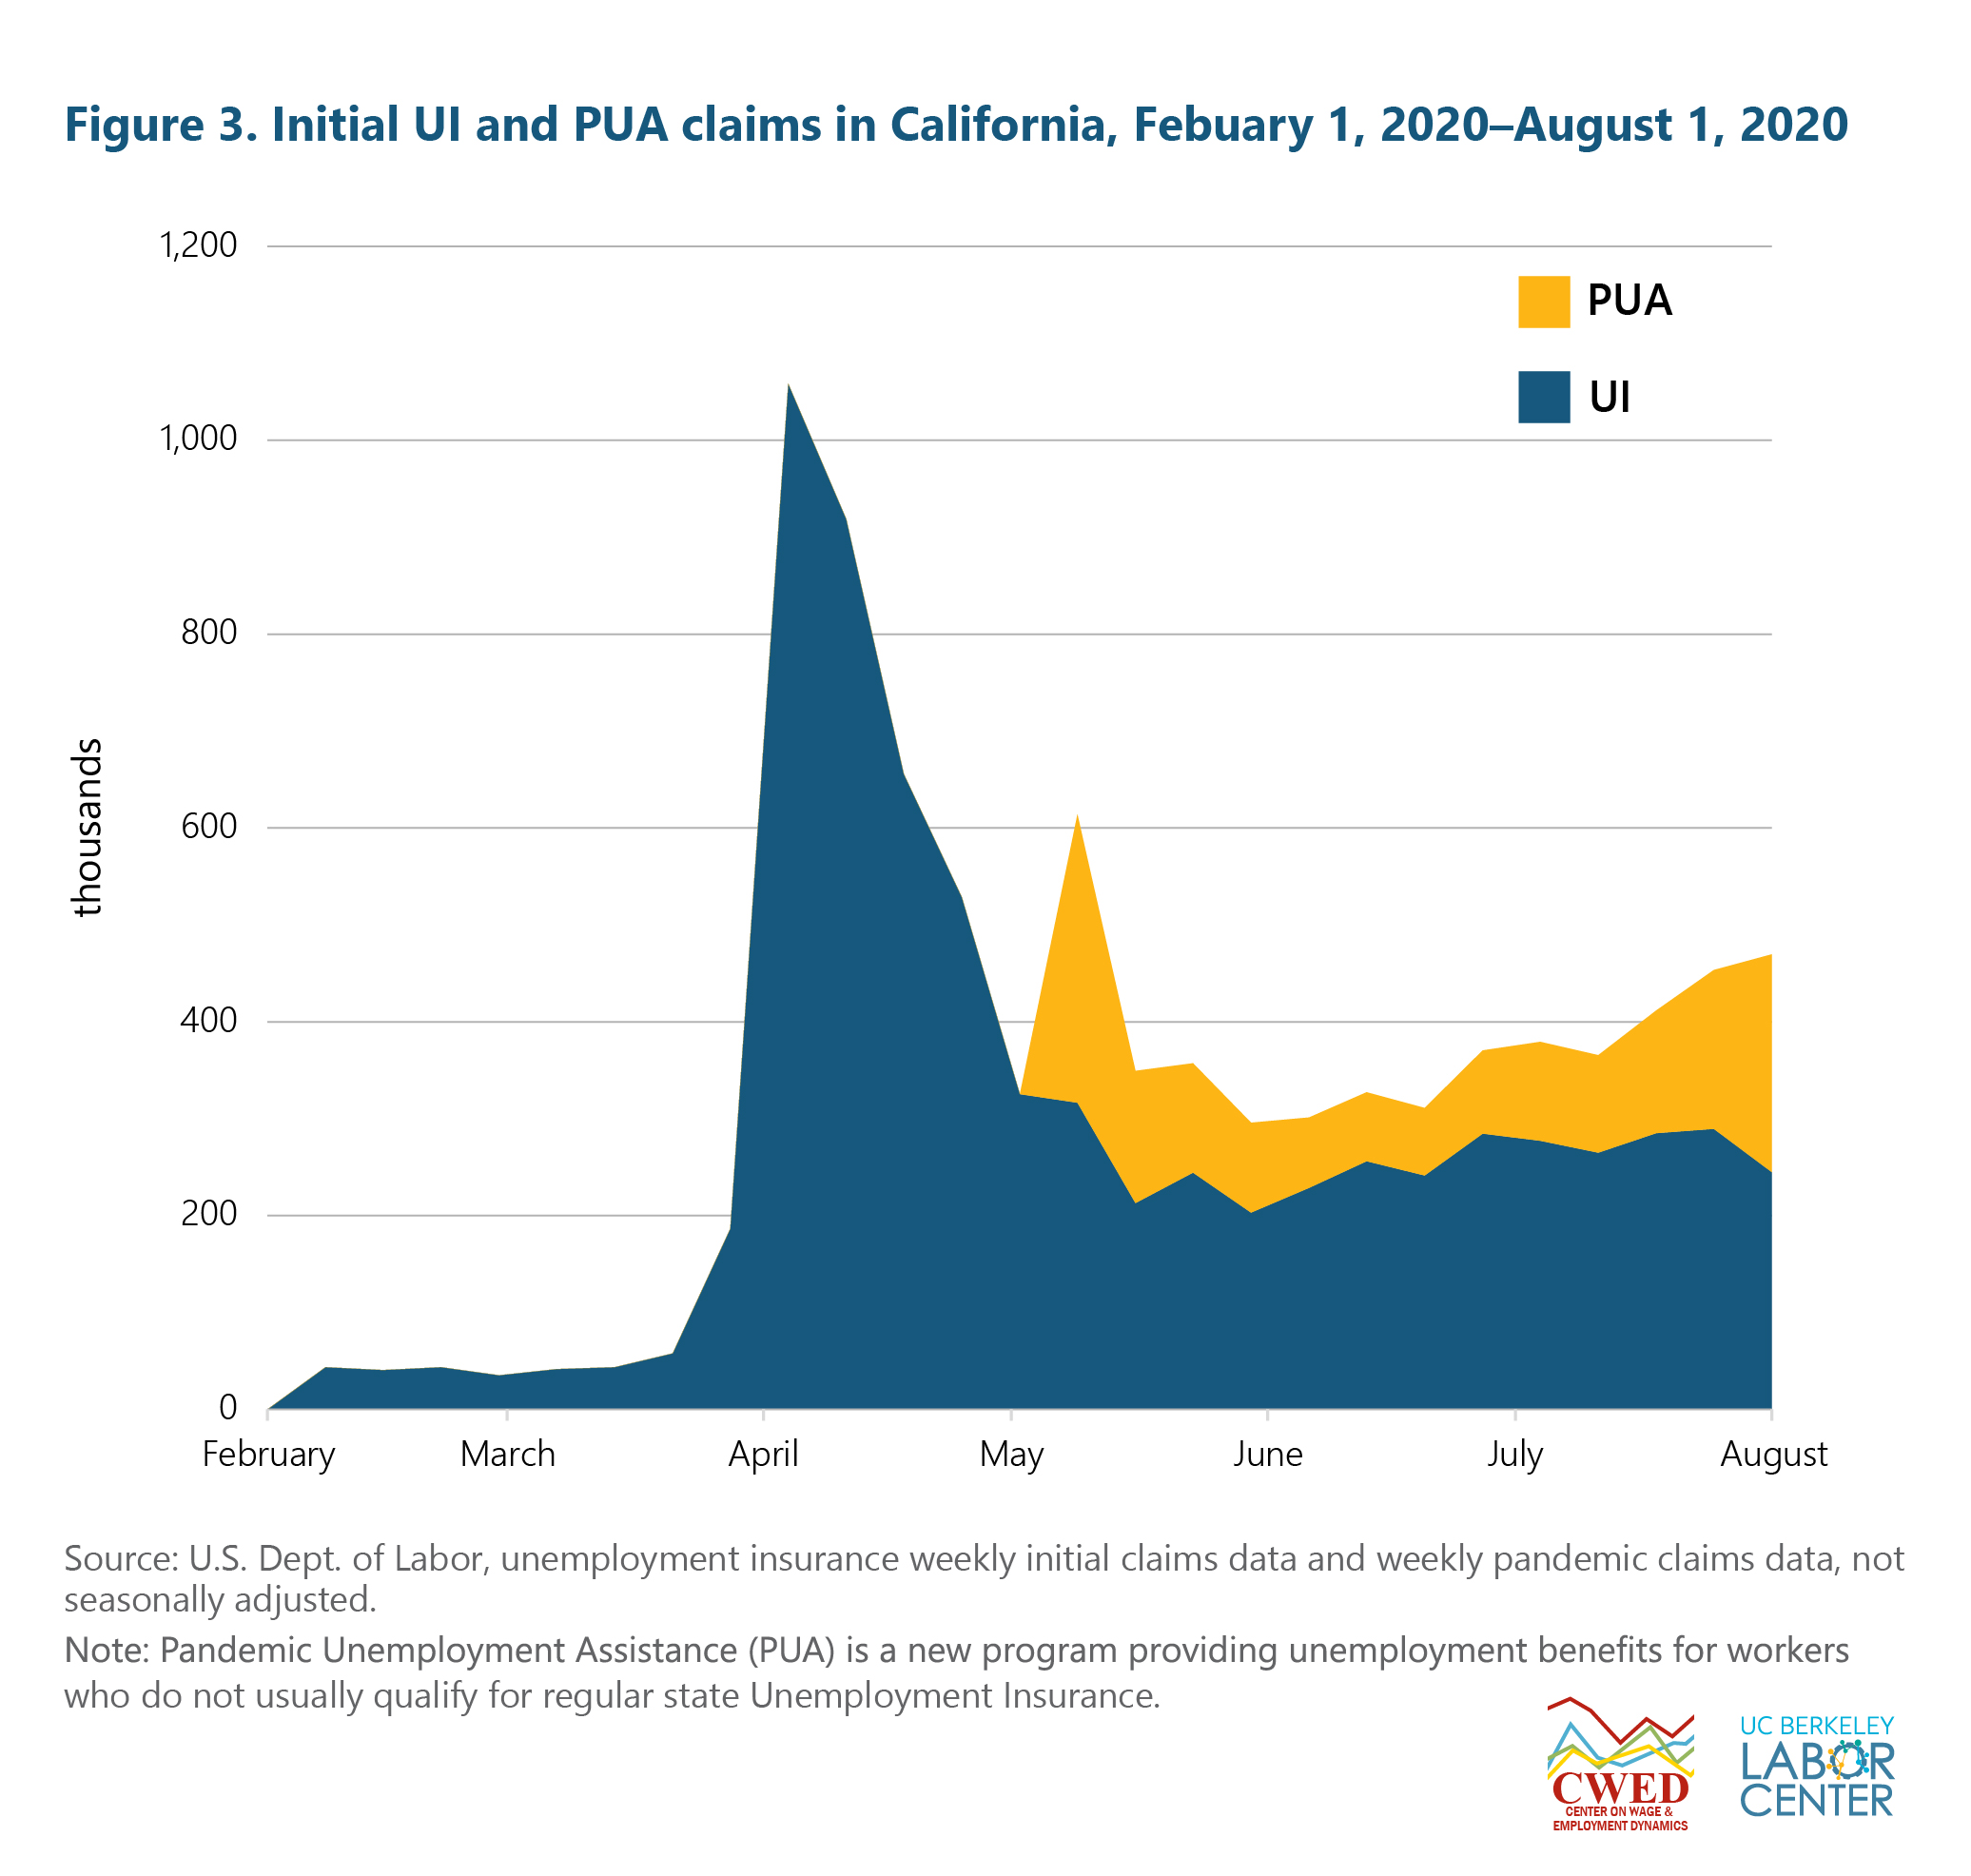
Initial weekly UI claims in California jumped from a pre-COVID average of about 43,000 the first week of March to 1.1 million the week ending March 28. From March 15 through August 1, initial UI claims in the U.S. totaled 51.7 million—Californians filed 7.3 million of them.
Importantly, filing an initial UI claim does not mean a worker will receive benefits, as many do not meet eligibility requirements.3 In response to the pandemic, Congress passed the Federal CARES Act. Along with other measures, it contained expansive provisions for the unemployed.4</ sup> It included new programs to address some of the inadequacies of regular UI. A big issue with the CARES Act and other relief is the fact that the pandemic-driven recession has no end in sight, while all the relief efforts do.
- Pandemic Unemployment Assistance (PUA) widens the UI net to include business owners, self-employed workers, independent contractors, and those with a limited work history.
- Federal Pandemic Unemployment Compensation (FPUC), in effect between March 29 and July 25, 2020, pays an additional $600 federal weekly benefit on top of the state benefit.
- Pandemic Emergency Unemployment Compensation (PEUC) permits states to extend unemployment benefits by up to 13 weeks. PEUC benefits are available after a state implements the new program, and ends on December 31, 2020.
Workers in the Golden State took advantage of these programs. Figure 3 shows initial UI claims more clearly than Figure 2 and includes initial PUA claims. For some perspective, the peak in weekly claims in California during the Great Recession was 115,462. The PUA program has thus far (May 2 through August 1, 2020) allowed an additional 1.9 million Californians to file for UI.
Continued UI claims measure the number of workers who are actively receiving benefits. Californians filed 6.6 million continued UI claims for the week ending July 18; regular UI account for 47.7% of these, while 48.5% were filed under the PUA program and 3.8% were filed under the PEUC program.
All UI programs have paid out approximately $460 billion in total across the U.S. (March-July 2020). During the week ending July 18, one in five workers (31.3 million) in the U.S. benefited from some form of UI payment. UI relief totaling $55 billion has aided one in four workers in the Golden State from mid-March to July 25.
The current ratio of UI benefits to wages and salaries illustrates just how heavily Americans are leaning on these benefits through the pandemic. In June, UI payments accounted for 15.6% of all wages and salaries in the U.S.5 By contrast, before the economic fallout of the virus, UI benefits were negligible in comparison—just 0.27% in February.
Importantly, substantial variation in UI payments exists between states, highlighting the continued need for federal assistance. Maximum weekly state UI benefits currently range from $240 in Arizona to $823 in Massachusetts; California’s top rate is $450 per week.6 This means that depending on where one lives, those who are out of work because of COVID-19 may face dire financial straits without expanded federal programs and payments.
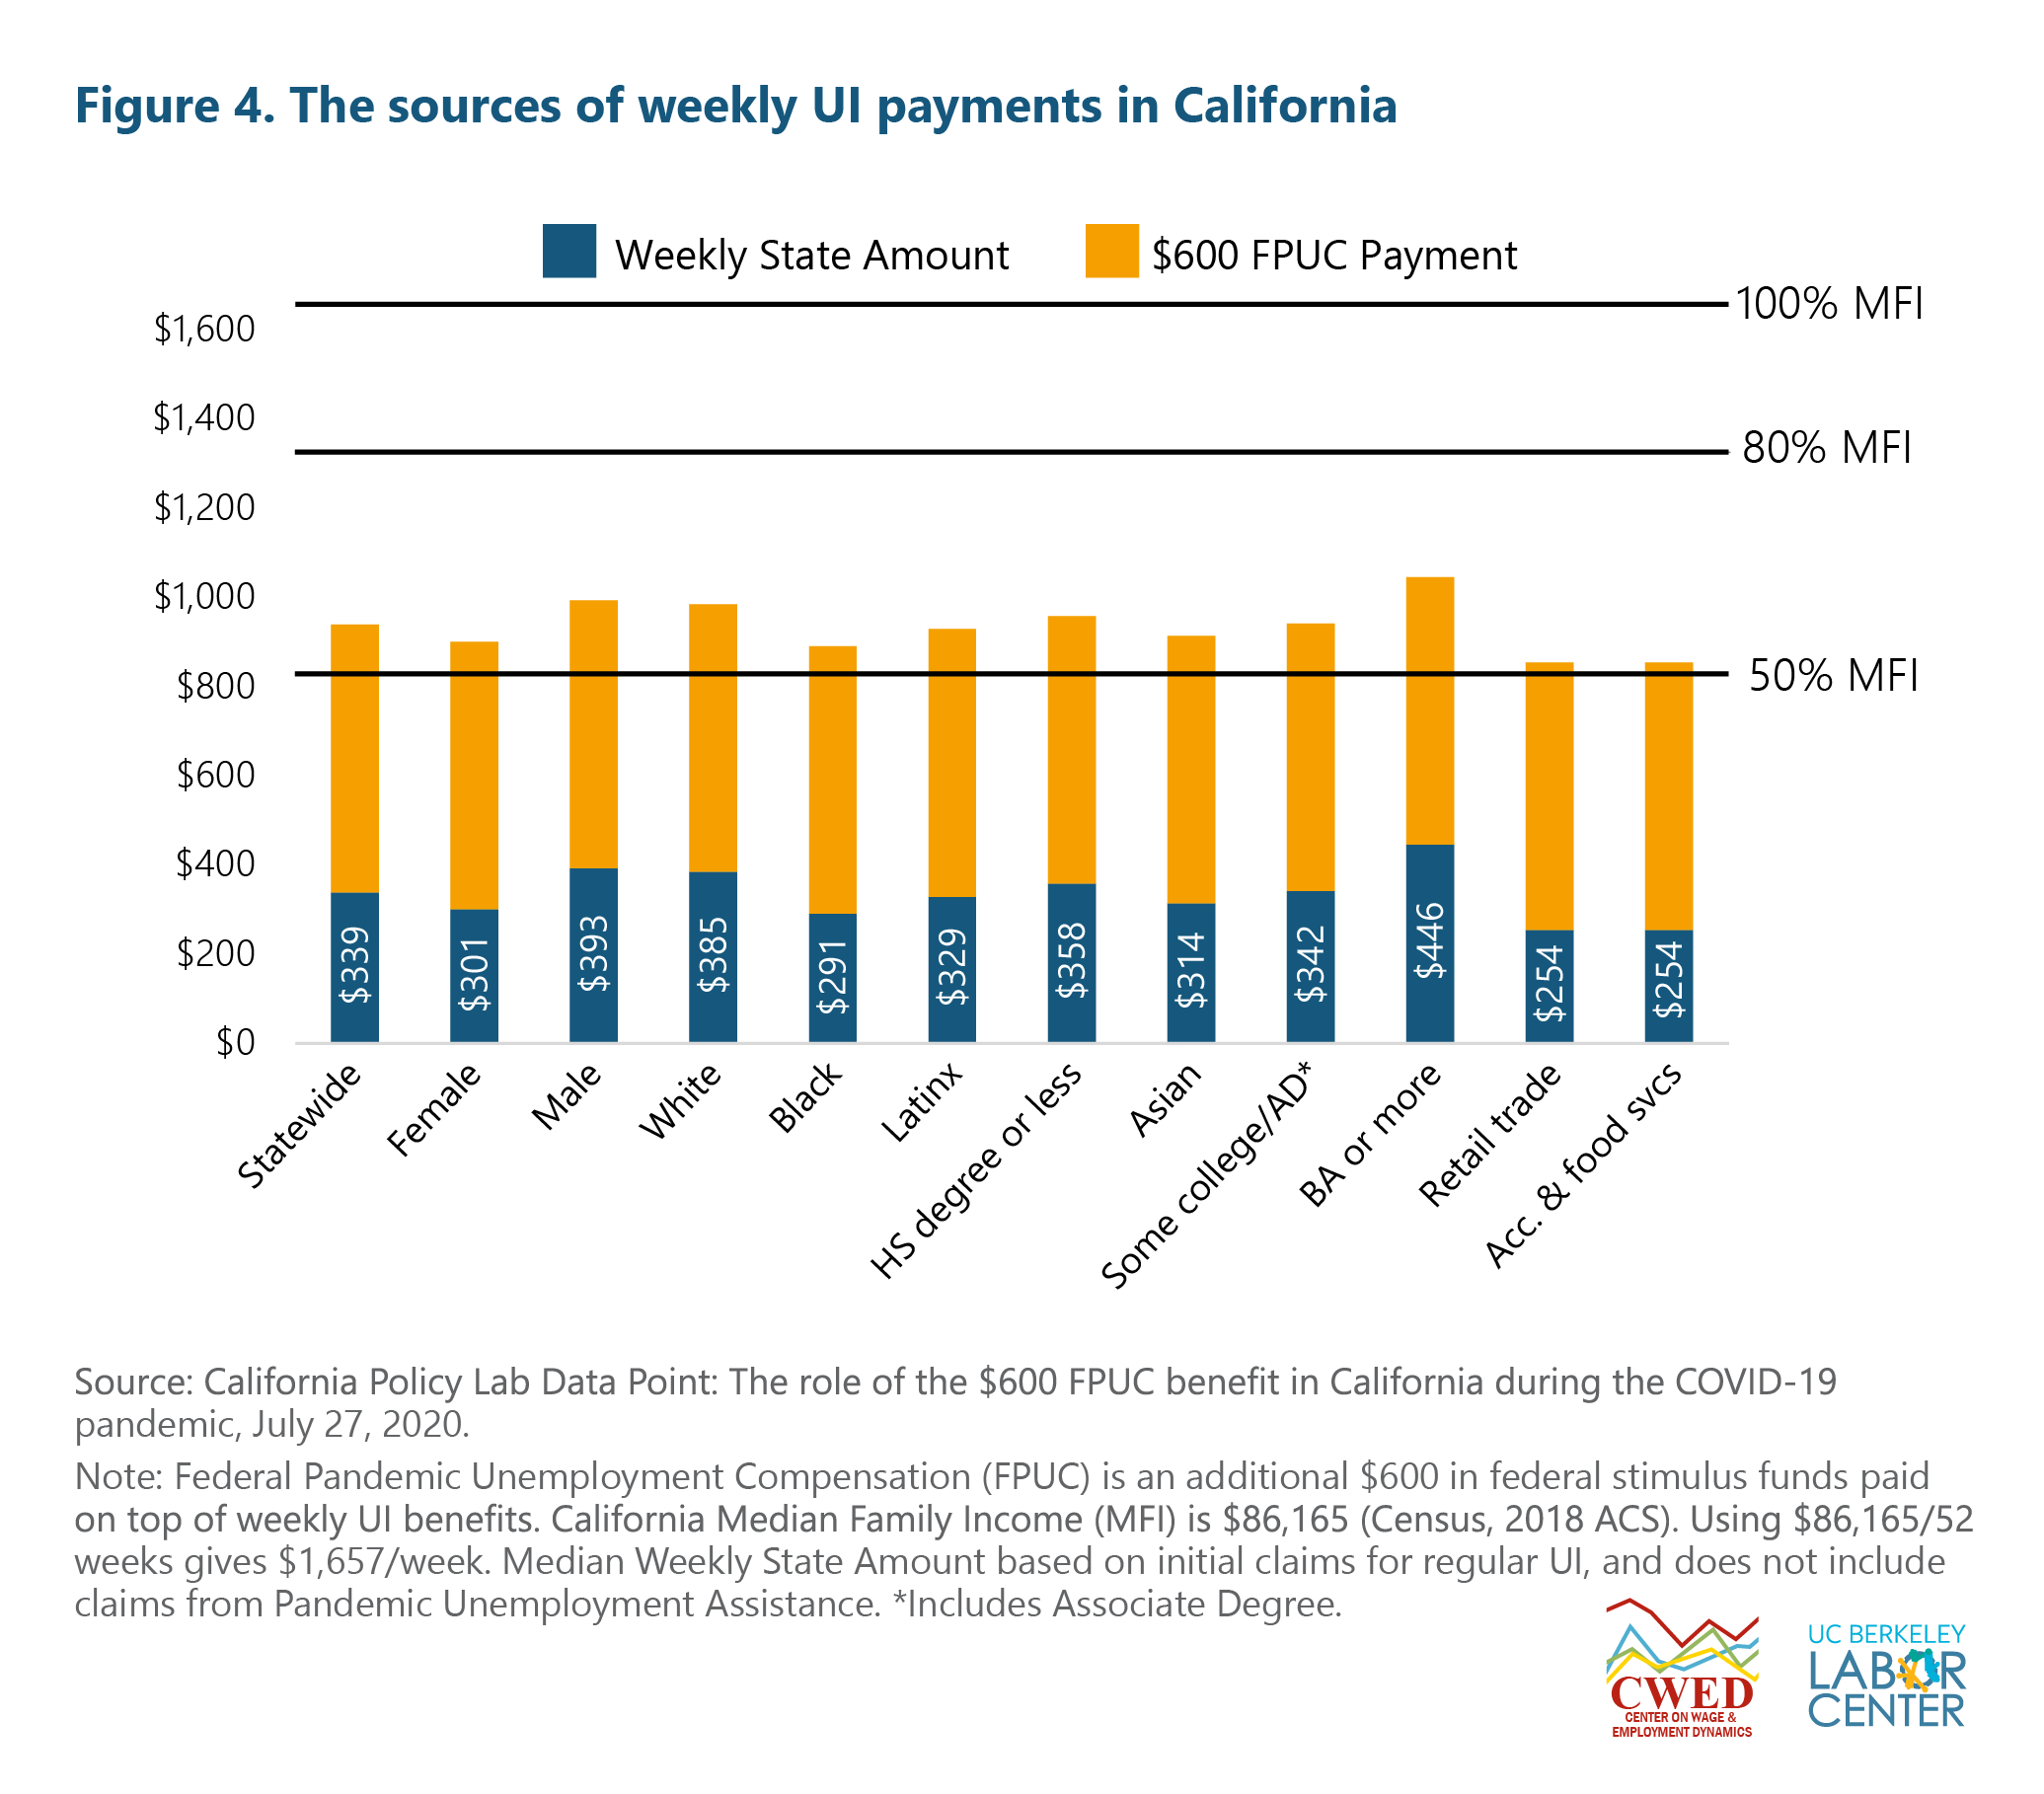
To illustrate, Figure 4 shows Californians’ median weekly UI state benefits (in blue) and the federal $600 weekly FPUC payment (in yellow) by demographic, education, and industry group relative to income thresholds. The median weekly UI benefit provided by the state of California (March 15 to July 25) was $339, well below even 50% of California’s median family income (MFI).
The extra $600 in FPUC payments made up the bulk of UI payments—keeping total median weekly benefits slightly above 50% of the state’s median family income (MFI) threshold across all groups. While the combination of state and federal UI benefits provided much needed relief, the FPUC program expired on July 31 and Congress has yet to act.7
The U.S. Census’ Household Pulse Survey provides near real-time data on the social and economic effects of the pandemic on American households. Over the crisis, many workers have reported struggling to meet basic needs in the face of income loss, with workers of color disproportionately impacted. Since mid-March, 64.8% of Latinx and 55.6% of Black households in California reported a loss of employment income, compared to just under half of White households. Moreover, in California, one in six households missed or deferred paying rent the previous month; approximately one in five Latinx and one in four Black households failed to make rent on time.
The Pulse Survey also tracks food security. During this pandemic, food insufficiency reported for the previous week averaged 44.6% overall. Black and Latinx households again struggled most, with 52.4% and 57.4% experiencing some level of food insufficiency respectively, whereas Whites experienced the lowest rate at 34.0%. Without expanded and more generous UI benefits, or some type of reoccurring payments such as Universal Basic Income, tens of thousands of families in California will not be able to afford housing, food, and other necessities.
Pulling back on federally provided economic relief in the face of woefully inadequate state UI programs and scant employment prospects for tens of millions of workers would result in a level of economic pain and suffering not experienced in the U.S. since the Great Depression. Big, bold economic relief that matches the magnitude of need can only come from the U.S. Congress. The importance and impacts of fiscal spending cannot be overstated. For example, EPI’s Josh Bivens estimated that failure to reauthorize FPUC would cost California an additional 836,142 jobs (4.7%).8 The Center on Budget and Policy Priorities estimated that the CARES Act kept 12 to16 million people out of poverty.9 And, getting back to work has been difficult; CPL reported that the majority (57%) of initial UI claims at the end of July in California were from claimants who went back to work only to be let go again.
Unemployment Rates
Weekly UI reports offer a timely insight to what workers are facing—a leading indicator of labor market conditions. The unemployment rate, widely cited in the media, is a bit of a laggard. Derived from the monthly Current Population Survey (CPS), for the most part it only counts unemployed respondents actively searching and available for work. Moreover, monthly data reflect conditions from the previous month. As an aside, the official rate of unemployment is not linked to UI claims—through they are correlated. We mention this as it has been a point of some confusion lately given the interest in the weekly UI reports.10

Figure 5 shows the official unemployment rates for the U.S. and California. They are the highest and fastest increases ever recorded, echoing that this is not a typical recession in any sense. Since the early-1990s recession, unemployment rates in California have always trended higher compared to those for the overall U.S., regardless of the business cycle. [Appendix Figure A1 shows California unemployment rates, by county, June 2019 compared to June 2020.]
The COVID-related rates, thus far, topped out at 14.5% and 16.4% in the U.S. and California, respectively, falling to 11.1% and 14.9% in June. These unprecedented official unemployment rates are likely below actual due to classification issues associated with the sudden, enormous COVID-19 induced changes in the labor market.11 The employment rate is another economic index that attests the mass exodus of workers. It is simply the employment-to-population ratio; it fell from 61.1% in February to 51.3% in April—reflecting an employment drop of 25.4 million. Employment grew by 8.8 million from April to June leaving the shortfall at 16.6 million. Keep in mind these figures do not count the underemployed, for example, full-time workers who are now working part time.
Unemployment rates in the U.S. were at historic lows before the pandemic. Long-standing demographic disparities held in the good times and continued to hold as unemployment rates shot up due to the COVID-19 shutdown. For instance, rates for White males went from 2.9% in February to 9.0% in June compared to rates for Black men that went from 5.8% to 16.3%. From February to June, unemployment rates increased for Latinas from 4.9% to 15.3%, and for Latinos from 3.2% to 12.8%, for Black women from 4.8% to 14.0%, and for White women from 2.8% to 10.3%.
Data continue to indicate how incredibly difficult it is to get the economy back on track with virus transmission rates that are far too high in many parts of the U.S. Joblessness has hit people of color, the less educated, and young workers that hardest. To date, even with improvement, the difficulty of getting back to work is far worse than at any point over the Great Recession—not even considering the risk involved.
Initial UI Claims in California by Worker Demographics and Industry
In the previous section, we presented demographic statistics for the U.S. that came from the CPS. However, monthly samples are too small to get reliable state estimates broken out by demographic group. Therefore, we turn to research conducted through a partnership between the Labor Market Information Division of the California Employment Development Department (EDD) and the California Policy Lab (CPL). CPL is a research center at the University of California, with sites at the UCLA and Berkeley campuses. This partnership has provided rich, timely information on workers affected by the pandemic-led recession. The next two tables report initial UI claims information based on EDD data and CPL reports.
Keep in mind that filing a UI claim does not guarantee payment of benefits; every applicant must pass eligibility criteria (see footnote #3). Table 1 reports initial UI claims broken out by four demographic categories (i.e., gender, race/ethnicity, age, and education). For this table (and the next), column (1) reports cumulative initial UI claims from March 15 through July 11. Column (2) reports the number of workers in the labor force as of February 2020. Column (3) gives the share of each subgroup (i.e., each row) that has filed a UI claim. For instance, of all female workers, 45% filed a UI claim. The last column (4) gives the distribution of total claims across subgroups within each of the four broad demographic categories; subgroups within each section sum to 100%. For example, across the gender category, women filed 51.2% of all claims while men filed 48.8%.
Importantly, column (3) shows which groups are disproportionately claiming UI benefits, tracking the demographically disparate rates of unemployment. Nearly half (49.5%) of all Black workers have filed a UI claim compared to 33.6% of Whites. Across education, 70.7% of workers with a high school degree/GED have filed a UI claim thus far compared to just 8.2% of those with graduate degrees. Generally, women, people of color, younger, and less educated workers have experienced disproportionate rates of job loss in California.
Table 1. UI claims in California, by demographics, cumulative March 15, 2020–July 11, 2020
| Demographic category | Total since March 15th | Workers in the labor force in Feb-2020 | Total claims as % of group labor force | Total claims as % of all claims |
| (1) | (2) | (3) | (4) | |
| Gender | ||||
| Female | 3,966,672 | 8,824,000 | 45.0% | 51.2% |
| Male | 3,780,511 | 10,605,000 | 35.6% | 48.8% |
| Race/ethnicity | ||||
| White | 2,523,852 | 7,506,246 | 33.6% | 37.0% |
| Hispanic | 2,565,518 | 7,304,335 | 35.1% | 37.6% |
| Asian | 1,223,578 | 3,035,206 | 40.3% | 17.9% |
| Black | 513,990 | 1,038,524 | 49.5% | 7.5% |
| Age | ||||
| 16-19 | 280,348 | 531,000 | 52.8% | 3.6% |
| 20-24 | 1,049,234 | 1,741,000 | 60.3% | 13.6% |
| 25-34 | 2,090,544 | 4,780,000 | 43.7% | 27.0% |
| 35-44 | 1,501,651 | 4,303,000 | 34.9% | 19.4% |
| 45-54 | 1,324,868 | 3,904,000 | 33.9% | 17.1% |
| 55-64 | 1,095,642 | 3,019,000 | 36.3% | 14.2% |
| 65-85 | 389,392 | 1,151,000 | 33.8% | 5.0% |
| Education | ||||
| Less than high school degree | 618,011 | 2,283,877 | 27.1% | 9.6% |
| High school degree/GED | 3,037,043 | 4,295,053 | 70.7% | 47.1% |
| Associate’s degree/Some college | 1,749,276 | 5,075,283 | 34.5% | 27.1% |
| Bachelor’s degree | 815,533 | 4,927,569 | 16.6% | 12.6% |
| Graduate degree | 232,358 | 2,848,218 | 8.2% | 3.6% |
Source: California Policy Lab, Series Report: California Unemployment Insurance Claims During the COVID-19 Pandemic, July 2, 2020, and CA EDD data. Many thanks to the Economic Development Department for providing updated data.
Notes: Claims refer to initial claims for regular unemployment insurance (UI) benefits among California residents. Does not include PUA claims. Tabulations based on initial UI claims file. Group tabulations for % of claims excludes claimants with unreported demographic group information. Labor force numbers have been calculated using a 12-month moving average ending in February from the CPS to be consistent with EDD’s numbers.
The same information is contained in Table 2, which reports layoff exposure across industries. Susceptibility is largely due to the degree of face-to-face interaction and/or the inability to work remotely. Important too was Governor Newson’s exemption from the shutdown order for essential workers. Of all initial claims, the largest share (17.7%) is in Accommodation & Food Services (which includes restaurants, bars, and hotels); over half (55.8%) of workers in that sector filed a UI claim. Almost half (45.2%) of workers in Retail Trade filed a claim, accounting for 13.8% of all claims. While a large share (53.0%) of workers in Wholesale Trade filed a claim, it constitutes a small share of all claims (3.8%) because it is a relatively small sector, comprising just 4% of the workforce in California.
Table 2. UI claims in California, by industry, cumulative March 15, 2020–July 11, 2020
| Industry | Total since March 15th | Workers in the labor force in Feb-2020 | Total claims as % of industry labor force | Industry claims as % of all claims |
| (1) | (2) | (3) | (4) | |
| Accommod. & Food Services | 961,532 | 1,724,000 | 55.8% | 17.7% |
| Retail Trade | 748,402 | 1,654,500 | 45.2% | 13.8% |
| Healthcare & Social Assistance | 724,762 | 2,461,900 | 29.4% | 13.4% |
| Admin. Support, Waste Man. | 407,640 | 1,143,700 | 35.6% | 7.5% |
| Manufacturing | 357,153 | 896,400 | 39.8% | 6.6% |
| Construction | 339,065 | 1,318,500 | 25.7% | 6.2% |
| Prof., Scientific, Tech. Services | 271,780 | 581,300 | 46.8% | 5.0% |
| Other Services | 260,808 | 332,500 | 78.4% | 4.8% |
| Education Services | 263,625 | 1,357,200 | 19.4% | 4.9% |
| Arts, Ent., Recreation | 242,967 | 689,700 | 35.2% | 4.5% |
| Wholesale Trade | 208,314 | 393,100 | 53.0% | 3.8% |
| Trans., Warehse., Utils. | 207,188 | 718,300 | 28.8% | 3.8% |
| Information | 166,750 | 586,600 | 28.4% | 3.1% |
| Real Estate & Leasing | 93,256 | 305,300 | 30.5% | 1.7% |
| Agriculture, Forestry, Fishing | 78,094 | 431,100 | 18.1% | 1.4% |
| Finance & Insurance | 59,315 | 544,100 | 10.9% | 1.1% |
| Management | 28,394 | 252,900 | 11.2% | 0.5% |
| Mining, Oil, Gas | 6,407 | 22,800 | 28.1% | 0.1% |
Source: California Policy Lab, Series Report: California Unemployment Insurance Claims During the COVID-19 Pandemic, July 2, 2020, and CA EDD data. Many thanks to the Economic Development Department for providing updated data.
Notes: Claims refer to initial claims for regular unemployment insurance (UI) benefits among California residents. Does not include PUA claims. Tabulations based on initial UI claims file. Group tabulations for % of claims excludes claimants with unreported demographic group information. Labor force numbers have been calculated using a 12-month moving average ending in February from the CPS to be consistent with EDD’s numbers. Many thanks to the Employment Development Department for these data.
Generally, the downturn has affected large shares of the workforce across all industries. However, white-collar dominated industries, such as Finance & Insurance and Management, have laid off relatively few workers.
Attempts to resume economic activity have been in fits and starts. Even when open, many businesses are struggling to survive. Restaurants and bars, for example, may be shuttered or operating far below capacity for a very long time. Many may not be able to reopen to any degree any time soon. As the economic fallout continues, we could see the jobless crisis broaden. Businesses that were able to cope with the initial economic jolt or a time of operating below capacity may not be able to do so for much longer.
Volatile Trends in Job Growth
Throughout the decade prior to the pandemic, the U.S. was experiencing a historic stretch of monthly job gains. The post-Great Recession consecutive monthly job streak started in October 2010. U.S. job growth averaged 196,000 a month, totaling 22.1 million before the virus-induced halt. California’s share of that job growth was 3.3 million, or 15% of the U.S. total. Nationally, combined jobs losses in March and April totaled 22.2 million—wiping out the decade of gains—before rebounds of 7.5 million over May and June, leaving total jobs lost at 14.6 million or 9.6%.
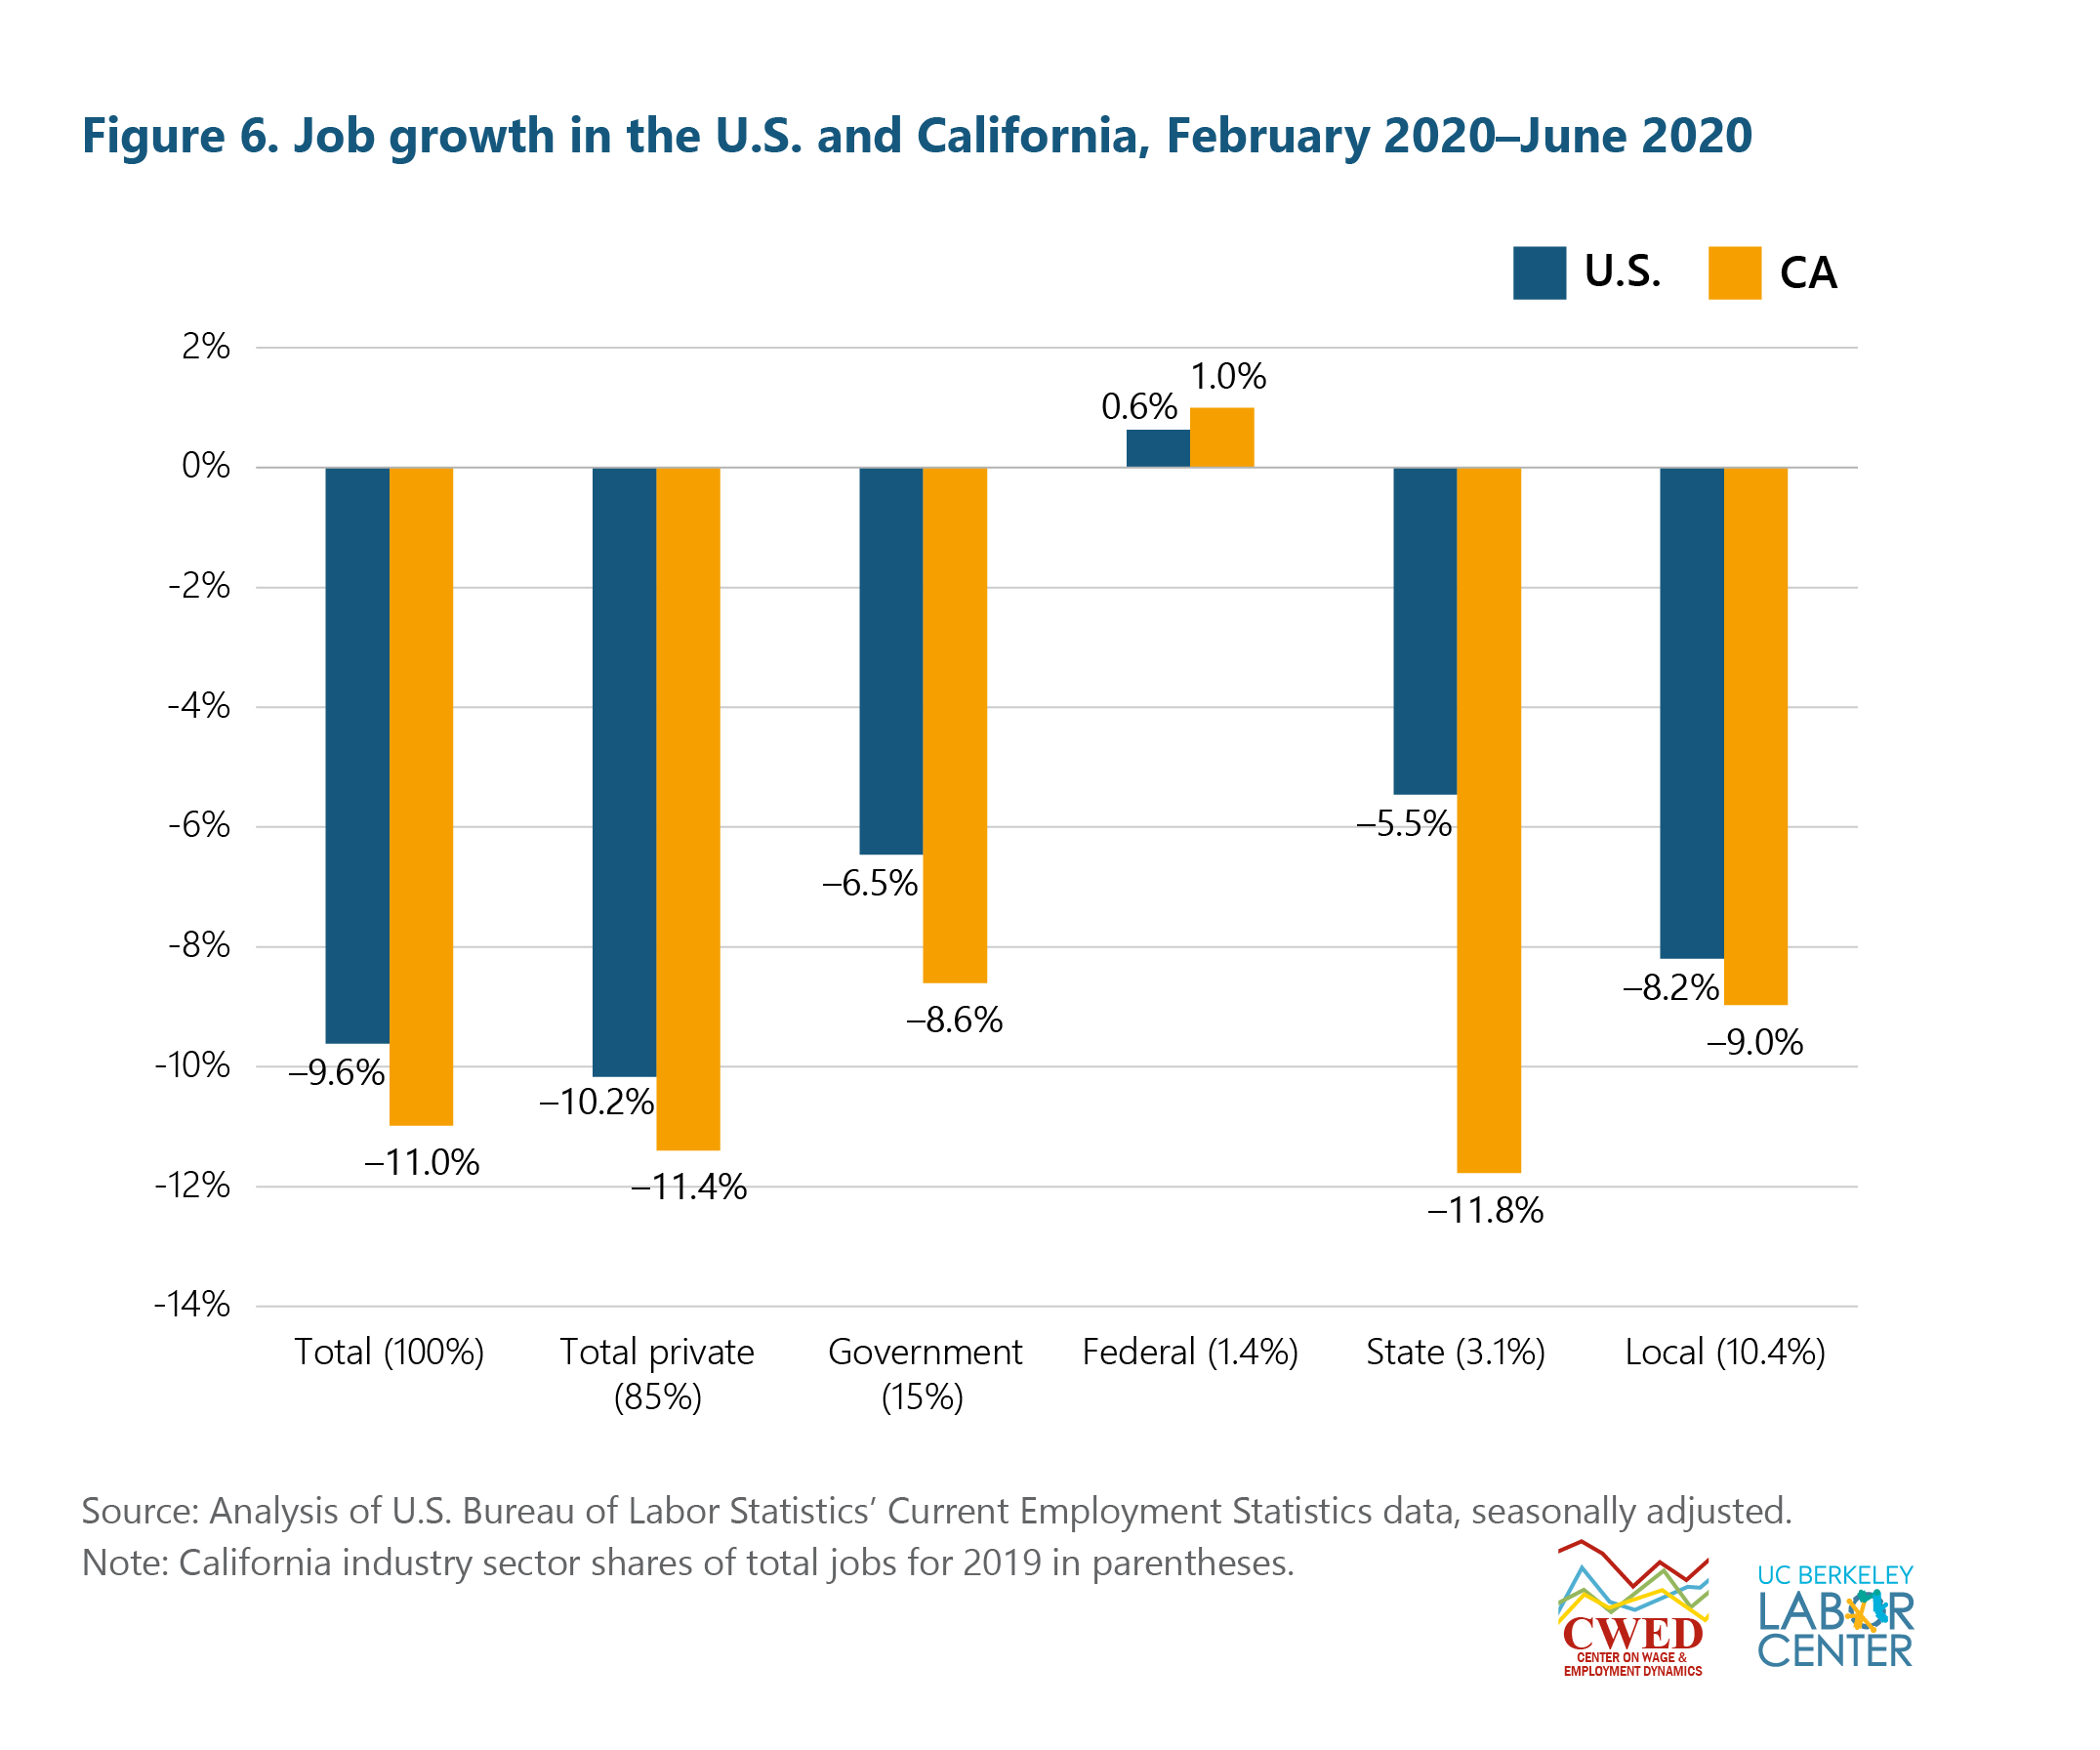
Figure 6 sums up the jobs situation from February through June for the U.S. and California across broad sectors. On a percentage basis, losses in California have been relatively larger than the country overall. For perspective, the U.S. trough of job losses over the Great Recession was -6.3%; in June they were down 9.6% in U.S.
Early in the pandemic, the Golden State shed over 2.6 million jobs (March and April combined) before initial reopening gains of 692,400 over May and June combined—leaving an 11.0% shortfall, worse than the -8.3% height of losses over the Great Recession.
The swift, devastating magnitude of job losses is unprecedented. However, it is important to bear in mind that they are, for the most part, an intentional byproduct of implementing public health precautions. Shuttering businesses and sending workers home were requisite to successfully controlling the spread of the novel coronavirus. Future trends in virus transmission, consumer confidence, and public policy will largely determine when and how quickly affected businesses and their associated payrolls might rebound. Many areas of the United States are currently struggling to get ahead of the virus in a substantive way that would allow for safe, widespread, and sustained reopening. It is likely in the coming months, given the lack of a cohesive national public policy strategy to keep the virus in check, that the trend in jobs may exhibit a two-steps up, one-step back trajectory.
While a hasty rebound is not wholly off the table for the private sector if the virus is controlled to a low and manageable level, a window that appears to be closing, there is little doubt state and local governments will be coping with the pandemic’s fallout for some time. As economic output severely contracted, so too did tax revenues. States, for the most part, must balance their budgets and they are not able to borrow money akin to what is available to the federal government. Thus, without significant relief provided by the federal government, states will face unprecedented challenges in affording the costs of controlling the spread of the virus on top of the usual outlays in running government.
As Figure 6 shows, states have already furloughed or terminated a significant number of public service positions. Overall, public employment is down 6.5% (-1.5 million) and 8.6% (-185,000), respectively, for the U.S. and California. A breakout of the public sector shows a mixed picture. The smaller federal sector is up a bit thus far by 2,500 (+1.0%) in California. However, the lion’s share of public employees (two-thirds) work for local government, where employment has contracted by 9.0% in California. Additional support for the government workforce merits consideration as its workers (e.g., educators, librarians, fire fighters, social workers, construction workers, and park rangers) help to support our communities, provide public education, enhance our lives, and keep us safe.
Simultaneous cuts in public sector budgets and employment, at a moment when more public services are required to address the pandemic, speak to the dire need for greater federal assistance. While the CARES act provided some $150 billion in relief funds for eligible state and local governments, California alone is facing a $54 billion deficit at the state level, composed of a projected $41 billion revenue decline, $7 billion growth in health and human services programs, and an additional $6 billion needed for other COVID-19 related responses.12 City governments are facing similar woes. For instance, San Francisco announced in May an expected budget shortfall of $1.7 billion over the next two years.13 Similarly, the City of Los Angeles is anticipating a $1 billion revenue drop through the current year and an additional $1 billion-plus drop through fiscal year 2020-2021.14 Such figures portend further public sector layoffs in the absence of additional federal assistance.
Importantly, public sector employment in California was flagging prior to the pandemic. Figure 7 shows the growth of the state’s public sector workforce relative to expected levels given population growth. Over the Great Recession, public sector employment declined rather dramatically for several years—short by 10.5% in 2013. By 2014, a sustained recovery took hold and the fiscal balance sheet slowly began to improve for the most populous state in the country—but the public sector jobs gap never closed.
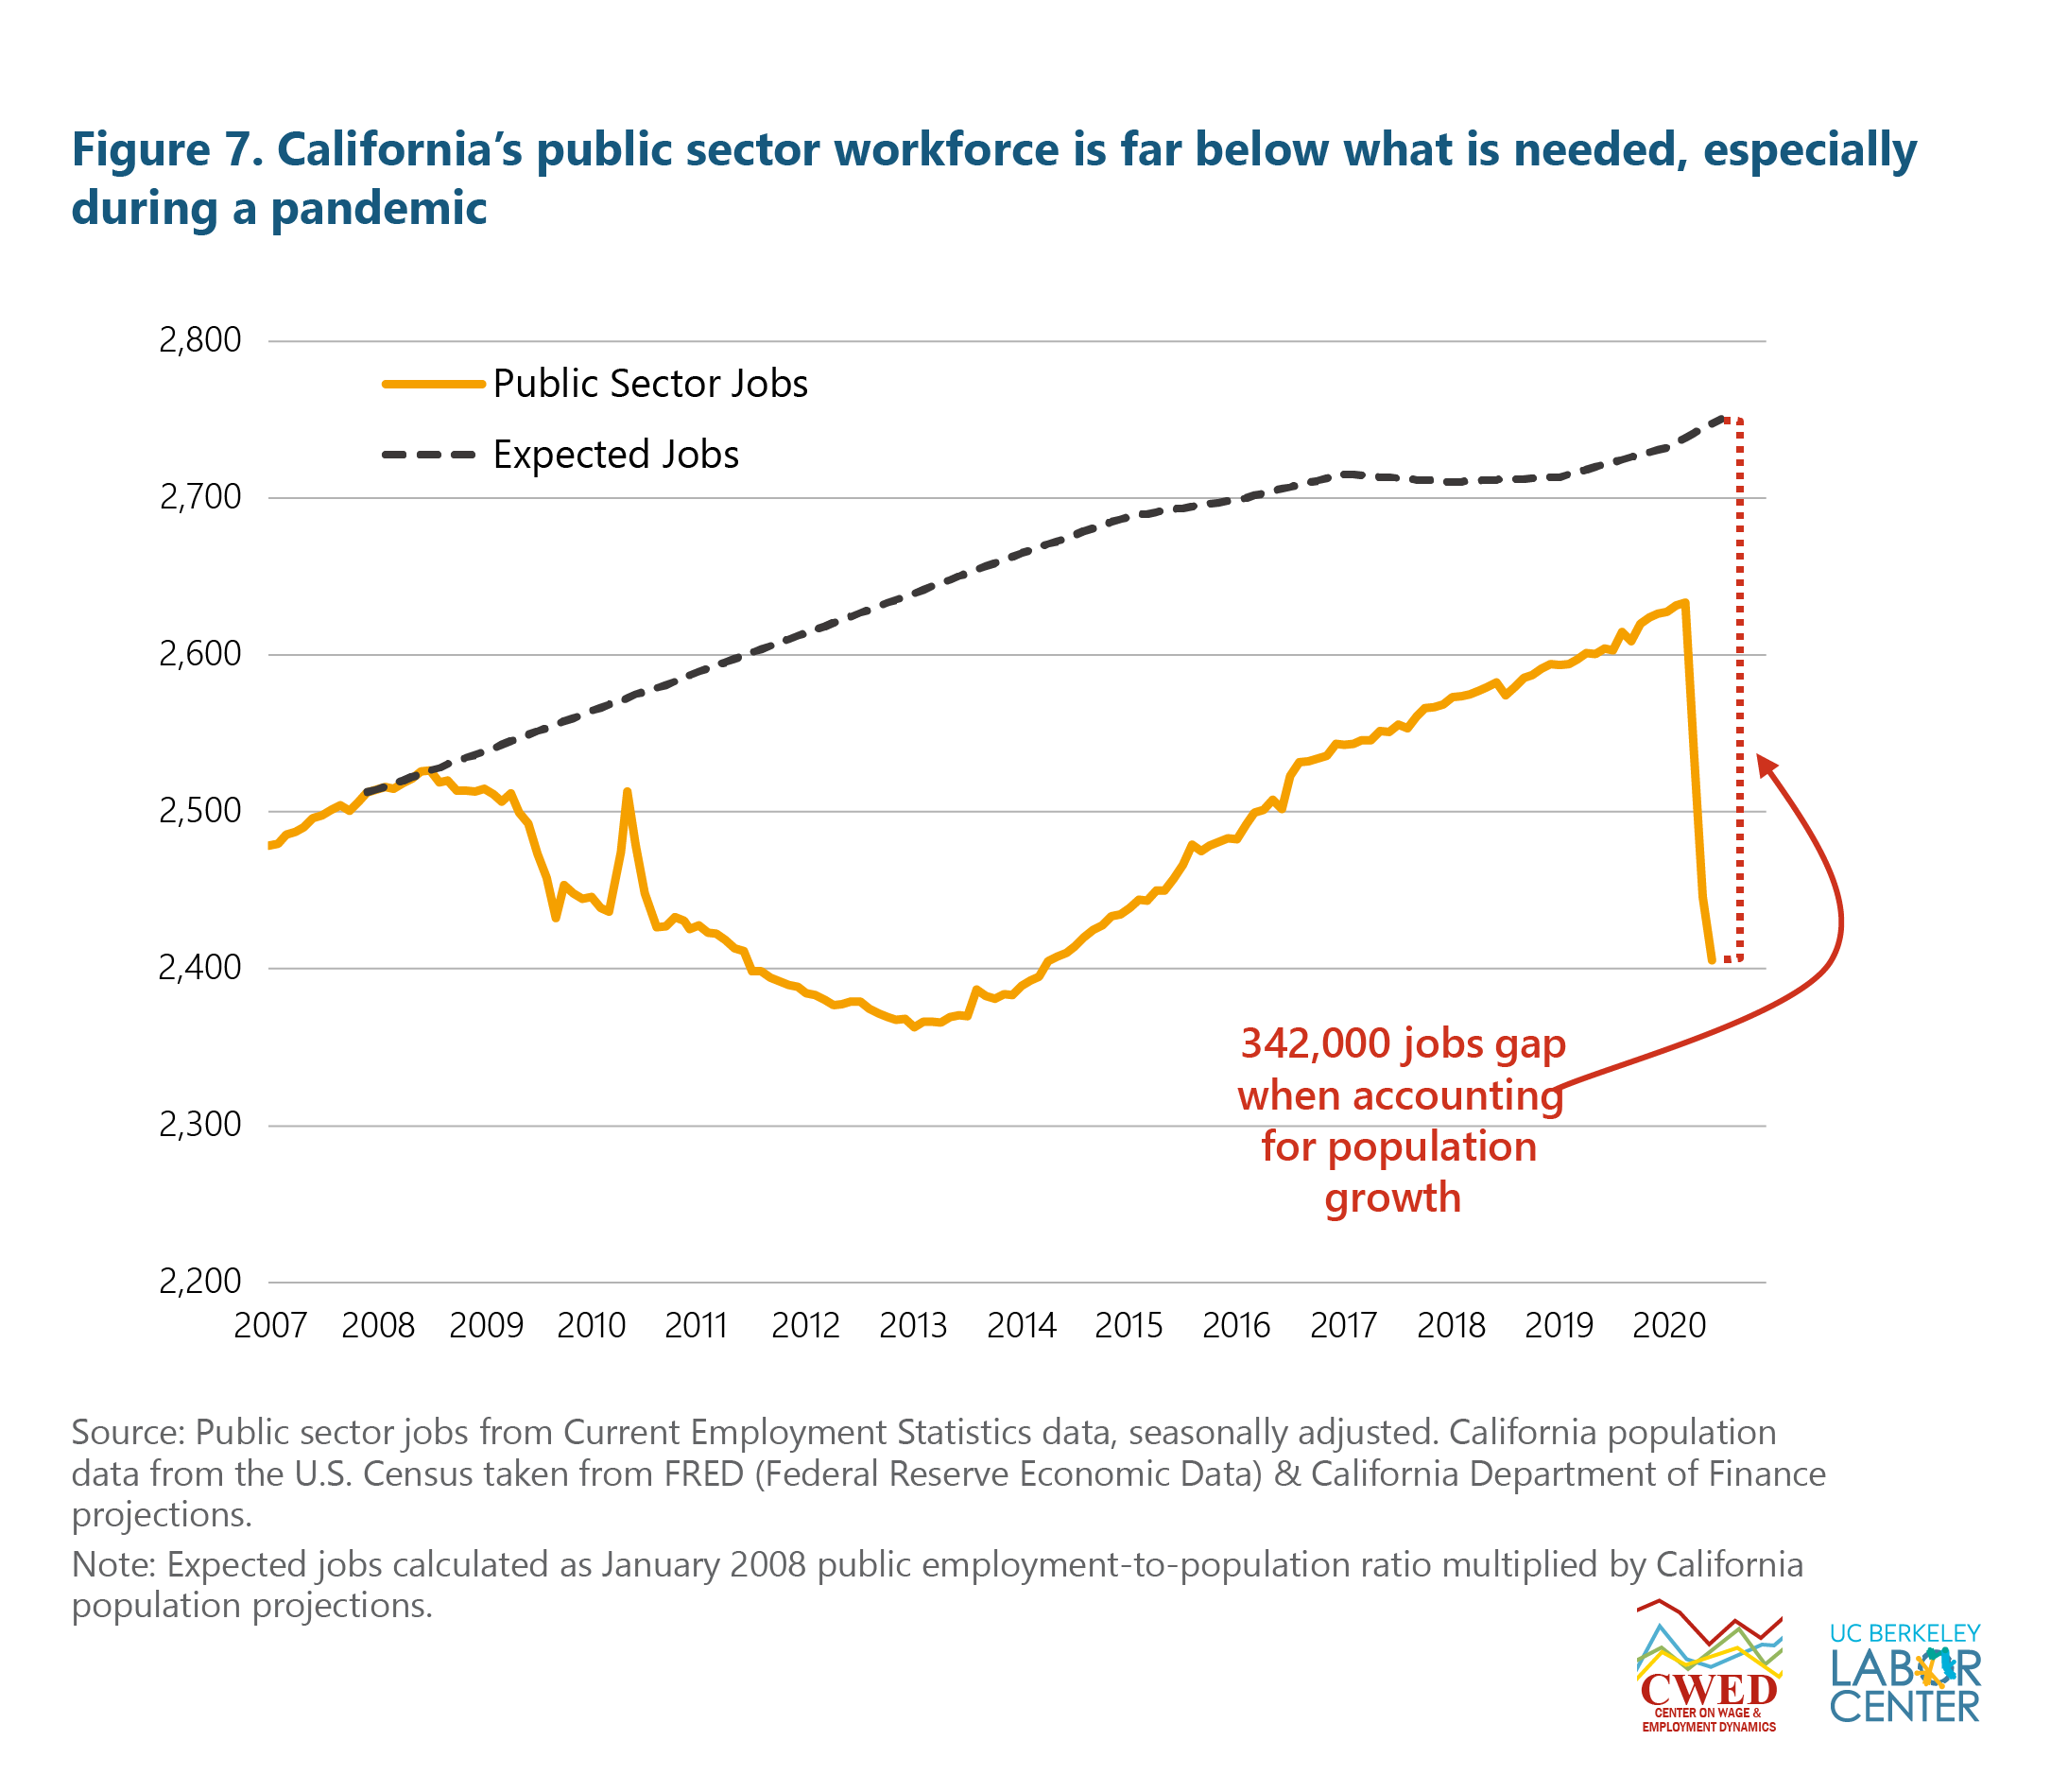
Then came the March 2020 shutdown, which has already resulted in a precipitous loss of the state’s public workforce. The chasm, a 342,000 shortfall in public employment, would be a challenge in normal times, but is even more formidable when the state needs public sector workers (e.g., teachers, public education staff, nurses, and health officials) to adequately address the crisis. Furthermore, disproportionately affected by losses of public employment jobs are Black workers. In California, Black workers make up 6% of the workforce, but 22.2% of the public sector workforce. Black families hit hard by the pandemic, both economically and in terms of their health, would benefit from mitigating job losses in the public sector.
It is hard to imagine how we can effectively keep ahead of the pandemic and open up the economy without significant investment in public infrastructure, which will require a dedicated workforce. California and its localities will continue to struggle with revenue losses as the costs of the efforts to respond to the health crisis mount. The needed cuts to balance the budget would be catastrophic. Cash-strapped states await a significant injection of funds that can only come from the U.S. Congress.
Job Growth in California, by Industry
The COVID-induced shutdown did not affect employment uniformly across industries. The extent of business closures within an industry was due to many issues, including the degree of person-to-person interaction, the capability of remote work, an ability to reorient the business model, and whether there was a government decree to shutter.

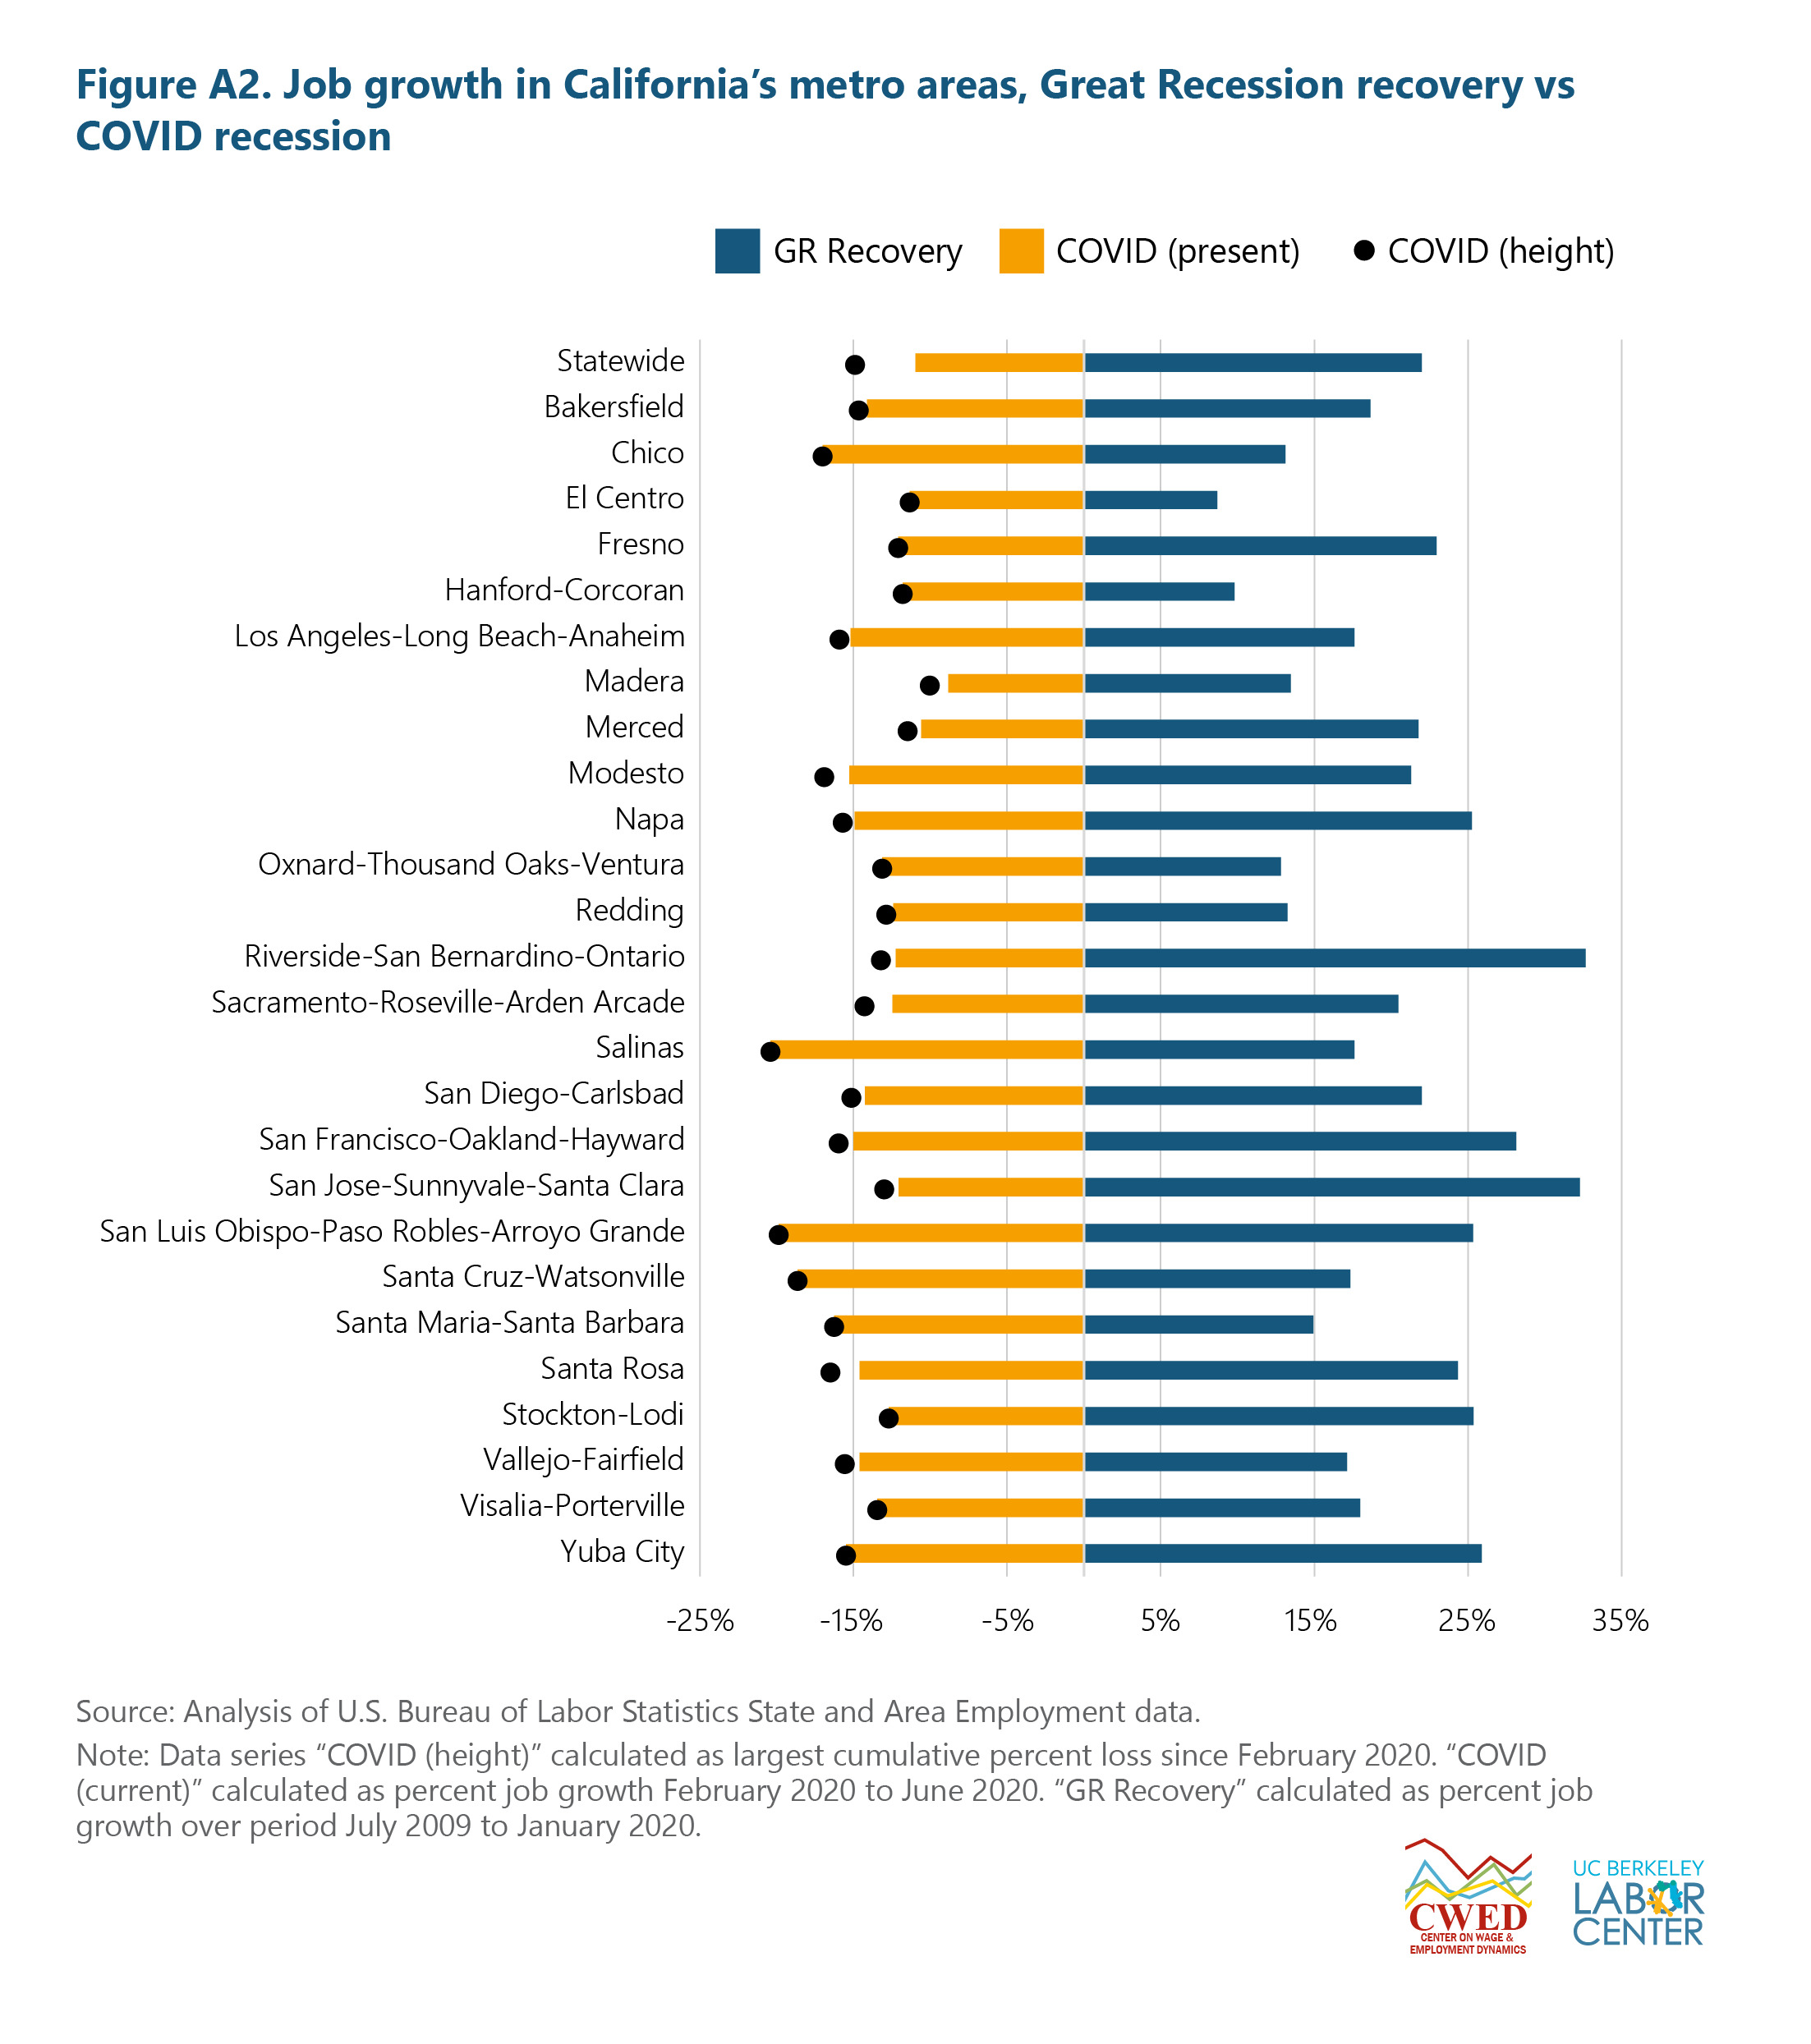
Figure 8 summarizes key points of job growth across industries in California. First, the blue bars represent post-Great Recession recovery growth. Keep in mind job gains in California post-Great Recession were notably slow—it took nearly seven years to shed and then regain the pre-recession level of employment in the state. The yellow bars show the percentage change in jobs from February through June of this year.
As areas across the state struggle to control the transmission rate of the virus, pull back orders have followed many attempts to reopen. Thus, the black dots give the percentage of losses at the worst point following the shutdown—highlighting how recent openings across the state affected industries differently. [Appendix Figure A2 shows these three points of information for metro-areas across California.]
Moreover, the relative size of each industry, as a share of total employment, varies greatly. Industry shares, reflecting 2019 averages, are in parentheses next to each industry name. For instance, while job losses in Professional & Business Services and Manufacturing fell at similar rates from February through June (-7.6% and -7.4%, respectively), the former sector is nearly double that of the latter.
As has been widely reported, the industries requiring personal services and/or face-to-face interaction—sectors such as Leisure & Hospitality (e.g., restaurants, bars and hotels—have been hardest hit by the pandemic. Leisure & Hospitality, at its worst point thus far, was down 48% as early and widespread orders to shutter took hold. California’s initial reopening attempts recorded a significant rebound of jobs in some industries. However, many were short lived as new shutdown orders followed as the coronavirus surged in parts of the state. Continued premature attempts to reopen, as coronavirus transmission remains high, are futile—our health and economic recovery depend on bringing down the rate of virus transmission.
Final Thoughts
The first COVID-19 case diagnosed in the U.S. was in late January. Essential workers made immediate, heroic sacrifices—staying on the job in the face of danger and uncertainty. As businesses shuttered and millions of workers walked away from their jobs, there was faith that the U.S. was well able to successfully respond to both the health crisis and the inevitable economic crisis, and would do so.
Our vast wealth, resources, and ability to apply the full force of the federal government gave us the means to respond efficiently and effectively to quickly gain command of the evolving crisis. Today it is clear that we have fallen short in both containment and economic relief. Further, the economic consequences are falling hardest on those who for far too long have been toiling on the wrong side of U.S. capitalism—people of color, immigrants, the working-class, and the poor.
We might re-examine the structure of work and the programs we administer in its absence. Unemployment insurance has been essential for mitigating financial ruin for tens of millions during COVID, but it provides neither enough security nor are its stipulations adapted for a public health disaster of this scale or duration.
In the U.S., without adequate childcare and given existing co-morbidities, a certain portion of the working population will not be in a position to accept work even if it becomes available. Many workers would have to abandon their children and/or impose serious risks to themselves and their families. Such refusal to take on available employment would traditionally disqualify claimants from receiving UI benefits. A more flexible, expansive program is necessary. Consideration of the moral imperative to provide universal healthcare and the means to satisfy basic needs like housing and food during the crisis logically follow. Forcing workers back on the job as the virus rages—often without adequate protections or family considerations—is cruel as well as counterproductive to controlling the pandemic.
Likewise, ensuring worker safety demands far greater attention. The Occupational Safety and Health Administration (OSHA) has not provided, beyond guidance, an effective worker protection response to the unique problems of COVID-19 in workplaces. As of August 6, 2020, OSHA reported that there have been 7,781 federal and 21,337 state complains filed by workers concerning the virus. Reports abound that OSHA has not prioritized enforcement efforts to protect essential workers like those in meatpacking, health care, and grocery stores.15
New mandates and strong enforcement of worker rights and protections are long overdue; these include clear standards throughout every workplace, protective equipment, hazard pay, and effective and efficient channels for worker grievances. Worker voices must be elevated such that they are able to secure safe conditions as well as hold accountable employers who either jeopardize safety or retaliate against workers who decline to put themselves at risk. Whether through traditional union channels, worker occupied safety-boards, or legislative edict, shielding from harm those who provide our goods and services is paramount to both economic recovery and virus containment.
We are in unchartered territory when it comes to the coronavirus-induced recession. However, we do know the sluggish pace of the Great Recession recovery, even with significant fiscal stimulus, was due to too little government spending. An economy operating well below capacity with interest rates near zero has only fiscal policy to consider. Those in Congress who put the brakes on more spending during the Great Recession, ostensibly concerned with runaway inflation and interest rates that never materialized, are doing the same now. The future cost will be that much more if we allow massive poverty, hunger, homelessness, and desperation take over the country for no good reason.
In his 1944 State of the Union speech, Franklin D. Roosevelt reflected on the most calamitous events of the twentieth century—the Great Depression and World War II. Through those crises, he noted, “we have come to a clear realization of the fact that true individual freedom cannot exist without economic security and independence. Necessitous men are not free men.” Upon highlighting the inadequacy of existing rights in assuring equality and the pursuit of happiness, FDR proposed an Economic Bill of Rights, often referred to as the Second Bill of Rights. Enumerated within was the right to decent housing and wages, a good education, medical care, and protection from the economic fears of old age, sickness, accident, or unemployment among others. COVID-19 has unmasked the same systemic inadequacies FDR hoped to remedy nearly 80 years ago. The relevance of the Second Bill of Rights in the context of the current crisis is palpable. The necessity of rights to economic security and well-being is every bit as urgent as it was during the Great Depression. The opportunity and roadmap for a radical restructuring of our economy to foster a just and fair society for all is in front of us.
Appendix

Endnotes
1 Data are from Opportunity Insights Economic Tracker.
2 An initial UI claim requests a determination of basic eligibility for the Unemployment Insurance program.
3 California Economic Development Department UI eligibility. .
4 A summary of California’s UI programs under the CARES Act.
5 Bureau of Economic Analysis, “Effects of Selected Federal Pandemic Response Programs on Personal Income,” June 2020.
6 2020 Maximum Weekly Unemployment Benefits by State. Weekly Unemployment Benefits by State.
7 President Trump signed an executive order for a $400 FPUC benefit with $100 coming from the states. It is far from certain and implementation will be difficult given cash strapped state budgets.
8 EPI blog, “Cutting Off The $600 Boost To Unemployment Benefits Would Be Both Cruel and Bad Economics.”
9 CBPP report “Failed Reopenings Highlight Urgent Need to Build on Federal Fiscal Support for Households and States.” July 9, 2020.
10 The Employment Situation report gives U.S. rates, typically released the first Friday of each month, reporting data for the previous month. Data are from the monthly Current Population Survey. The State Employment and Unemployment report data is typically released mid-month.
11 Read about classification issues in the Employment Situation Report.
12 California Department of Finance, Fiscal update May 7, 2020.
13 City of San Francisco, Office of the Mayor, Budget Impacts as a Result of COVID-19.
14 County of Los Angeles, Facing deep impacts from COVID-19, LA County Unveils Recommended Budget for 2020-21.
15 See ProPublica’s piece by Michael Gradbell “Millions of Essential Workers Are Being Left Out of the COVID19 Workplace Safety Protections.” April 16, 2020.
Authors
Sylvia A. Allegretto, Ph.D. is an economist and co-chair of the Center on Wage and Employment Dynamics at the University of California, Berkeley.
Bryce Liedtke is a graduate student researcher at the Labor Center. He received his master’s degree in public policy from UC Berkeley’s Goldman School of Public Policy in May 2020.
Suggested Citation
Allegretto, Sylvia A., and Bryce Liedtke. “Workers and the COVID-19 Recession: Trends in UI Claims & Benefits, Jobs, and Unemployment.” Research Brief. Center on Wage and Employment Dynamics and Center for Labor Research and Education, University of California, Berkeley, August 18, 2020. https://irle.dream.press/workers-and-the-covid-19-recession/.
The analyses, interpretations, conclusions, and views expressed in this report are those of the authors and do not necessarily represent the UC Berkeley Institute for Research on Labor and Employment, the Center on Wage and Employment Dynamics, the Center for Labor Research and Education, the Regents of the University of California, or collaborating organizations or funders.
