

An up-to-date picture of COVID-19’s labor market impact is now available, thanks to researchers at IRLE, the California Policy Lab, Rustandy Center for Social Sector Innovation at Chicago Booth, and the University of Chicago Poverty Lab. They are taking advantage of granular data on exact hours worked among employees of firms that use the Homebase scheduling software. Check back for updates:
Updates:
Post Seven: Labor Market Recovery Stalls as COVID-19 Cases Surge
Post Six: Measuring the Labor Market Since the Onset of the COVID-19 Crisis (August 3)
Erratum: Corrected estimates of layoff and hours changes in Homebase data
Post Four: Update with Homebase Data Through May 9 and Description of Homebase Firm Characteristics
Post Three: Update with Homebase Data Through April 25
Post Two: Update with Homebase Data Through April 11
Post One: Initial Analysis of Data Through March 28 and Methodology
![]()
![]()
![]()


Update with Homebase Data Through May 23
Fact #1: Firms continue to reopen and restore workers’ hours.
Note: The results described in Figure 2 have been updated due to an error. Click here for the complete erratum. The error did not affect any of the other figures or results.
Thirty percent of firms from our baseline sample remain shutdown, down from a high of 45 percent in the beginning of April (Figure 1). Of the firms that ever have shutdown, nearly half (44%) have now reopened and remained open through last week.
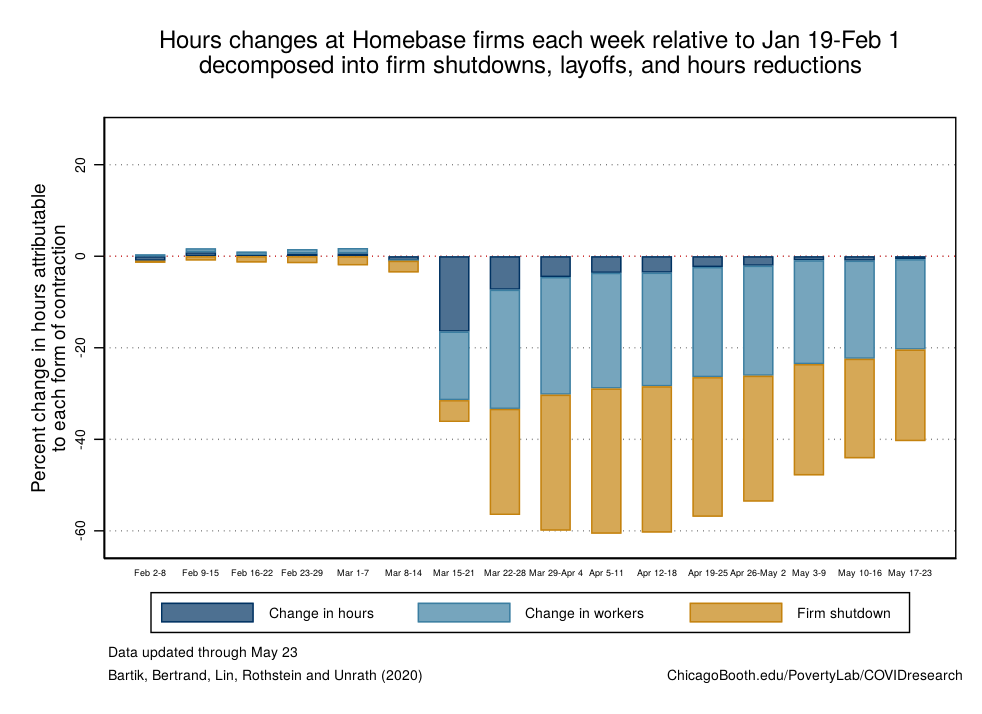
Hours worked last week were 32 percent lower than the average in our baseline period. That’s down from nearly 60 percent in mid-April (Figure 2). That recovery is mainly attributable to firms reopening and firms restoring work some of their workers’ hours. The share of hours lost due to being laid off at a still open firm has remained fairly constant (2 to 4%) since the beginning of the crisis. That recovery is mainly attributable to firms reopening. The share of hours lost due to firm closure declined from about 32 percent in mid-April to 20 percent last week. The share lost due to layoffs fell from 25 percent in mid-April to about 20 percent last week.
Figure 2 (Updated)
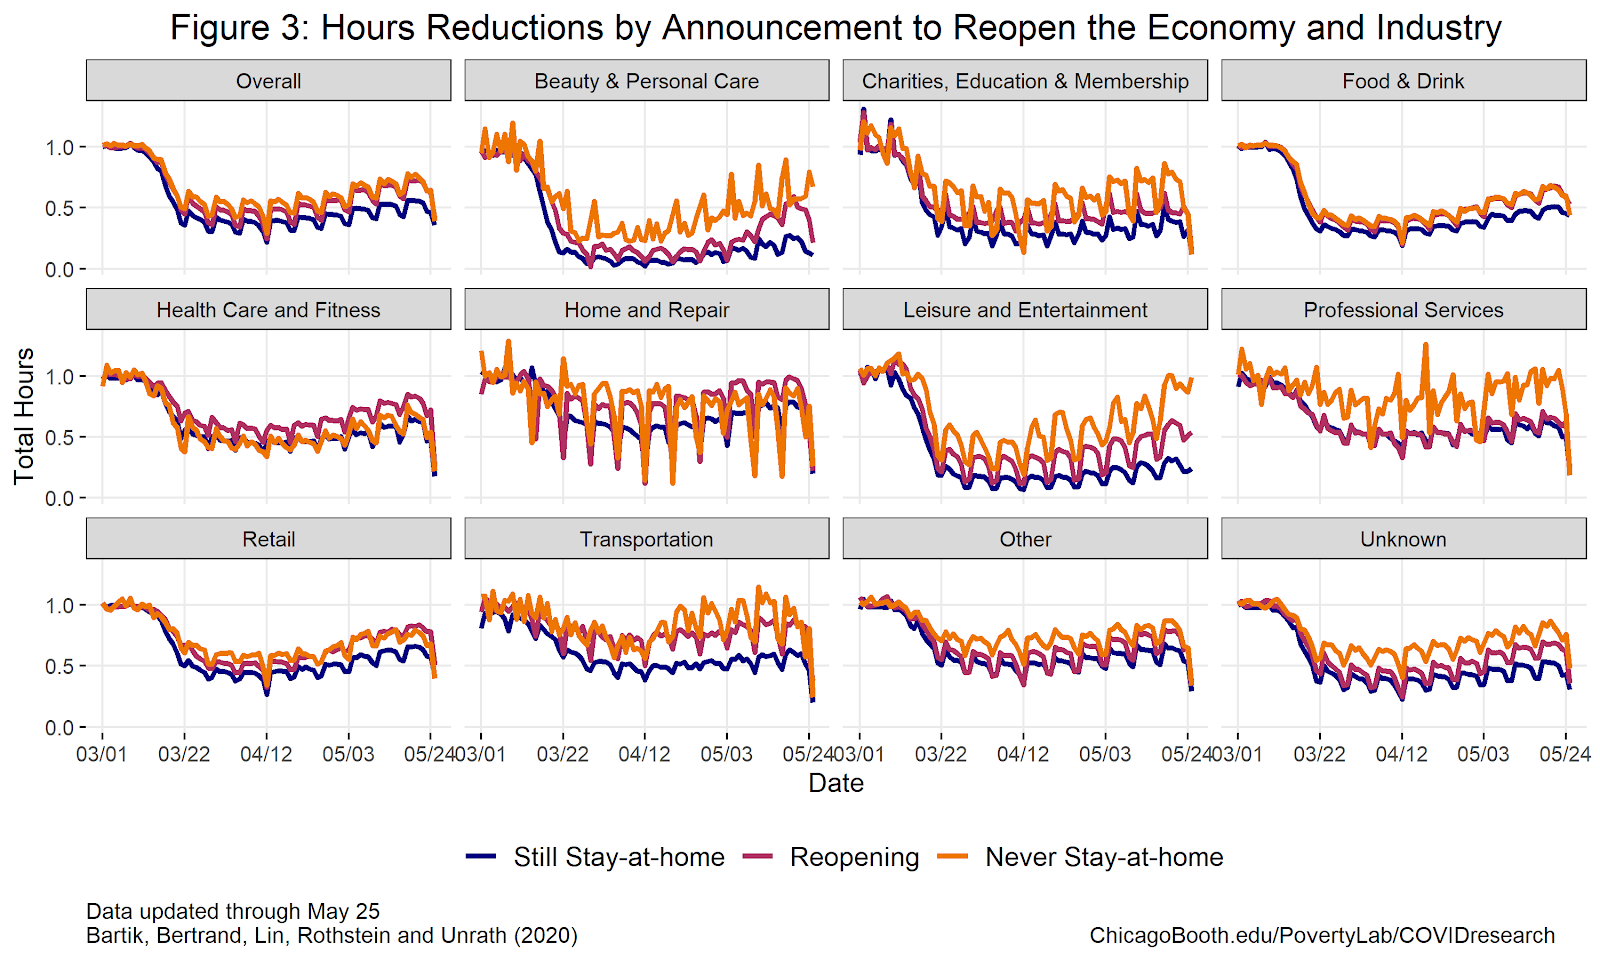
Fact #2: Firms in “reopened” states have restored the largest share of hours.
Hours also bounced back more in states that moved to reopen than in states that never shutdown or remained shutdown (Figure 3). In these “reopened” states, total hours in the past week (May 17-23) were 56 percent higher than their respective low. In states that remain shutdown, hours were 47 percent higher, and in states that never closed businesses, hours are 40 percent higher.
We should note that these differences may not be the result of states’ decision to reopen or remain shutdown. The likelihood of reopening is related to local disease burden and a number of other factors, which themselves are related to policymakers’ decisions about allowing firms to reopen. It’s also worth noting that, though there is a difference, the gap remains fairly limited. Government shutdowns of non-essential businesses do not appear to be the only obstacle to firms reopening.
There are notable industry differences as well. Hours at beauty and personal care firms and leisure and entertainment firms are 370 and 215 percent higher than their respective lows. Hours at “transportation and professional services firms are only 20 percent higher than their lows.
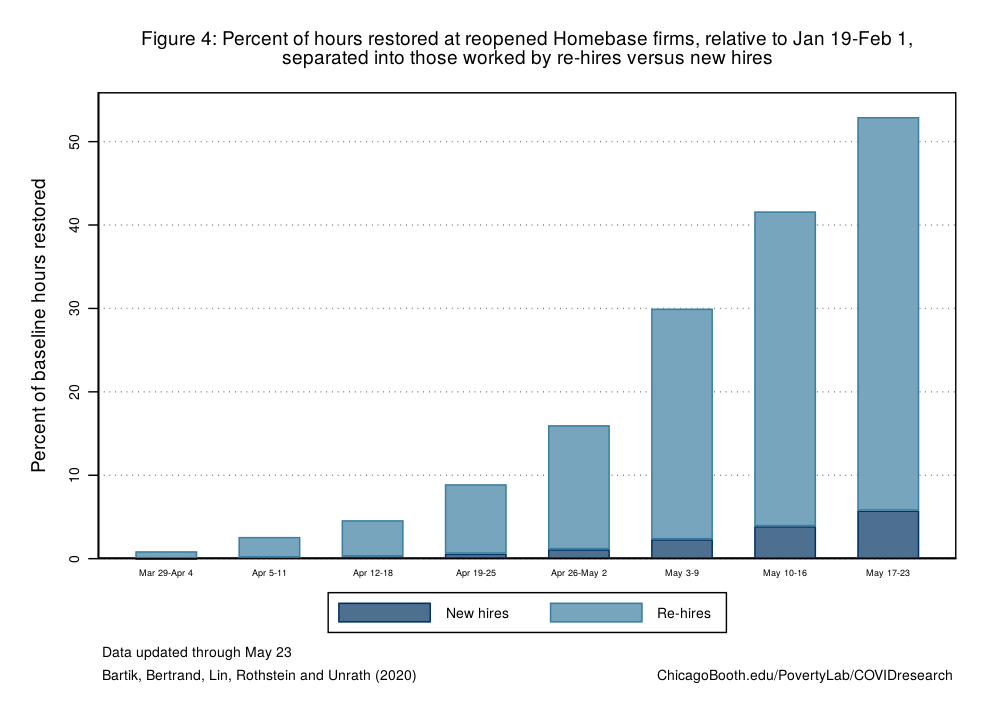
Fact #3: Reopened firms tended to re-hire original employees, but they’ve only restored a portion of their original hours.
In Figure 4, we show how much these firms’ baseline hours and workforce were restored through each week. By last week, these re-opened firms had collectively regained over half of their baseline hours and nearly 60 percent of their baseline employment levels. As in our last update, almost 90 percent of this reemployment came through re-hiring employees who worked at the firms before they shutdown, as opposed to new hires. This suggests that, so far, most worker-firm matches at these firms have been maintained through the crisis, firm-closures, and re-openings.
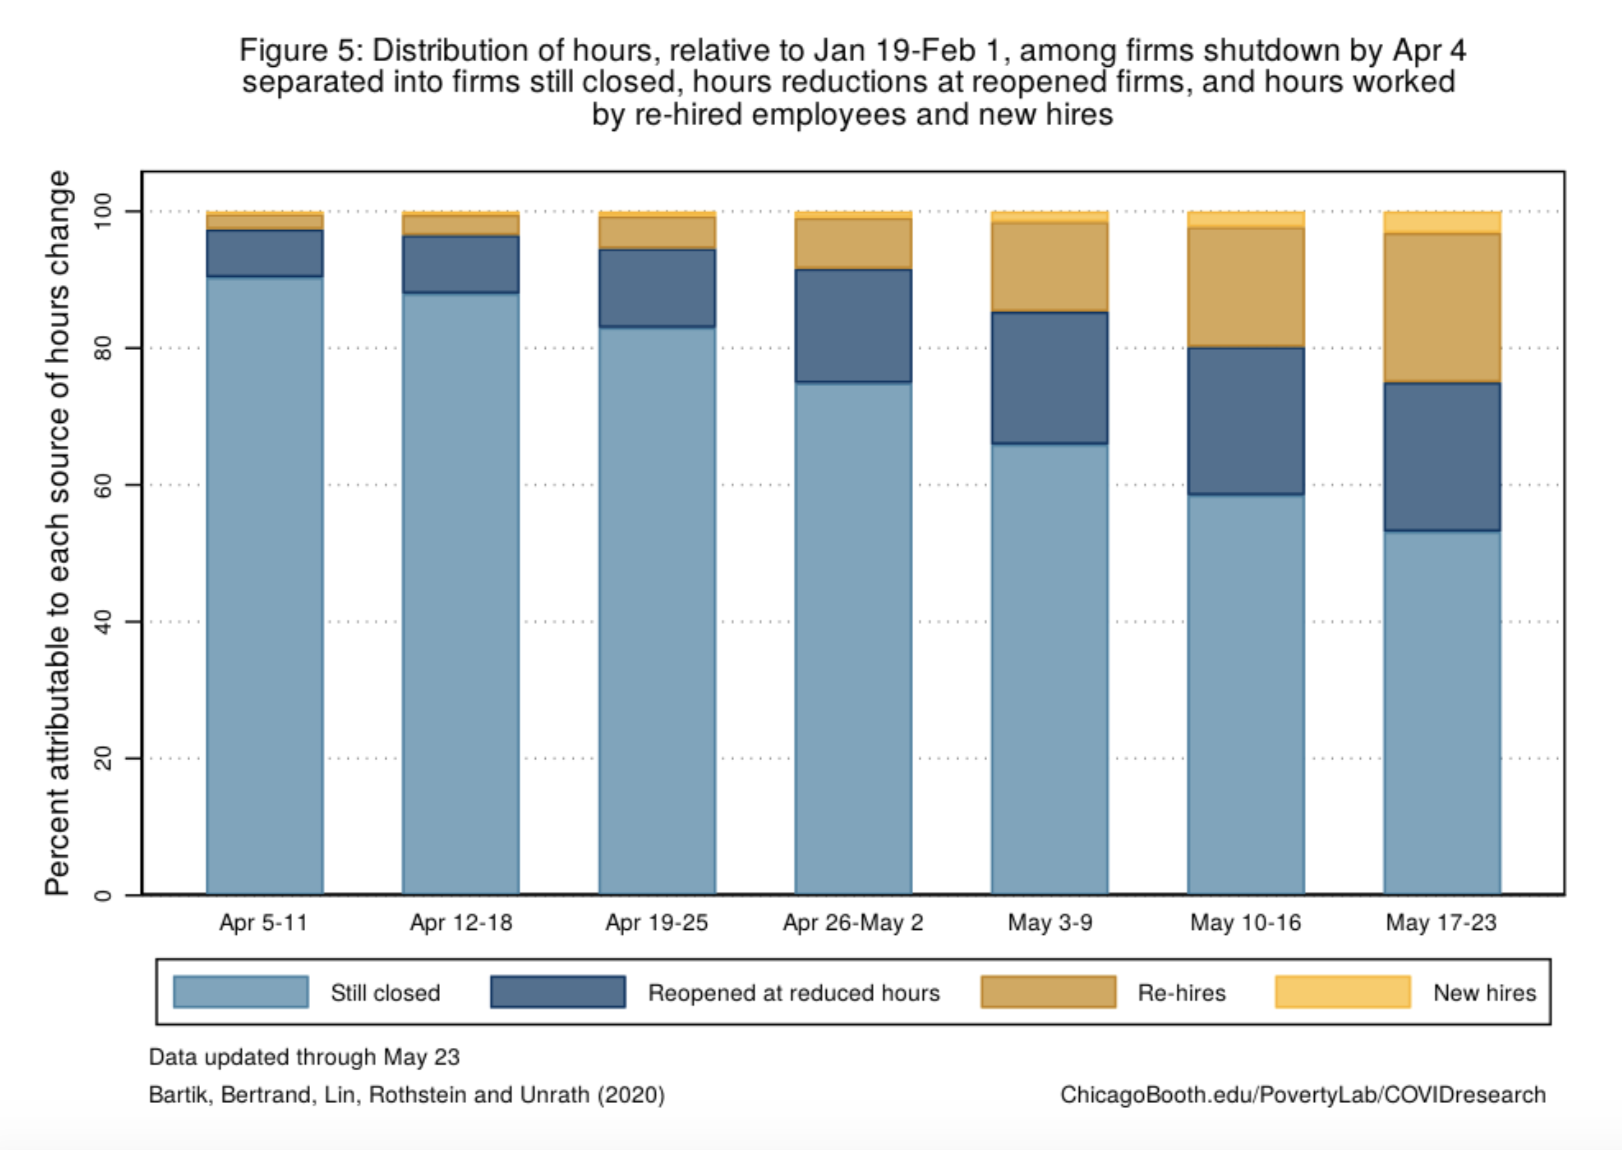
Figure 5 shows how hours have been restored (or are still missing) among firms that shut down before April 4. Across these firms, just over half of their collective baseline hours remain missing due simply to ongoing firm closures. Another 22% of hours are lost because reopened firms are operating at reduced scale. Counting all of the firms that have ever shut down, only about 25 percent of pre-shutdown hours have been restored. And again, almost 90 percent of those hours are worked by individuals employed by the business before it shutdown.
Describing Homebase Firm Characteristics
Our analysis is based on firms that use Homebase, which are not representative along many dimensions. They tend to be smaller than average, and concentrated in particular industries (such as food and drink and retail).
Below, we provide information on three characteristics of the firms in the Homebase data: the regions they are located in, the industries they operate in, and the number of employees they have. This information is based on firm characteristics between January 19 and February 1 and includes all firms operating during this time period, regardless of whether they have continued to operate through the COVID-19 crisis or not.
Figure 6: Homebase Firms Broadly Match the Distribution Across US Regions
This figure shows the share of Homebase firms located in each Census region (in light blue) and compares these shares to each region’s share of total employment (in dark blue), as measured by the Bureau of Labor Statistics (BLS) data. Homebase firms are somewhat concentrated in the West region and less concentrated in the Northeast and Midwest than overall employment.
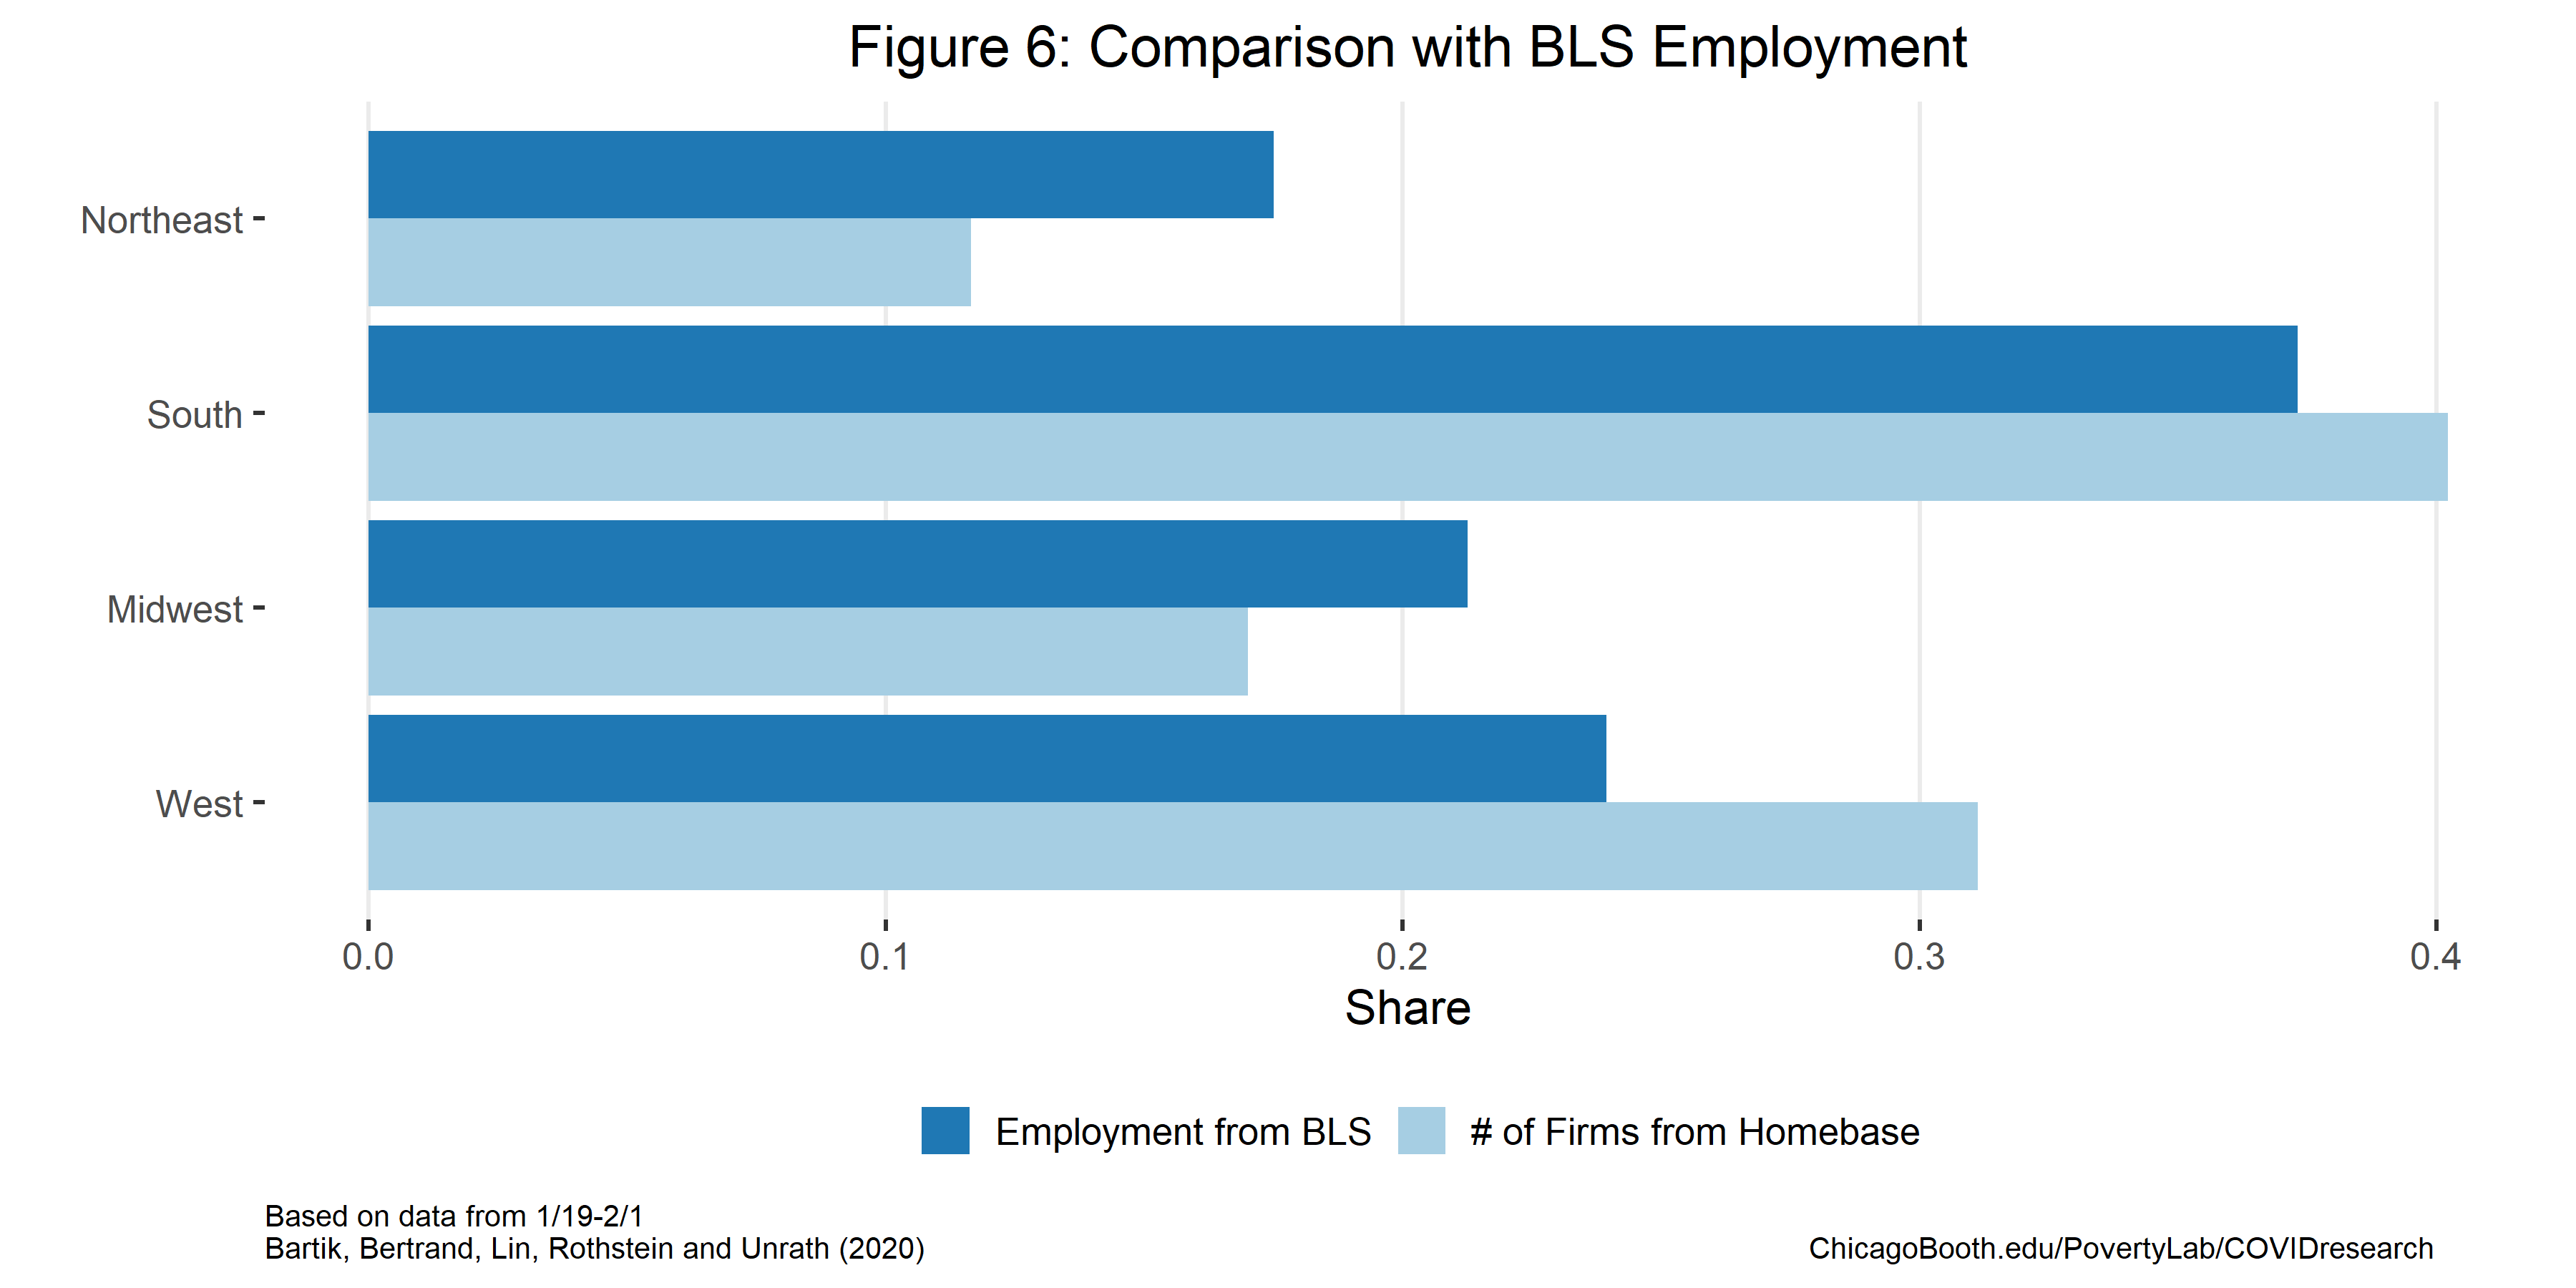
Figure 7: A Majority of Homebase Firms Are in the Food and Drink or Retail Industries
This figure shows the share of Homebase firms in each of the nine industry categories that Homebase uses. As might be expected given that Homebase offers scheduling and time-card software, Homebase firms are predominantly in industries like food & drink and retail that employ many hourly workers.
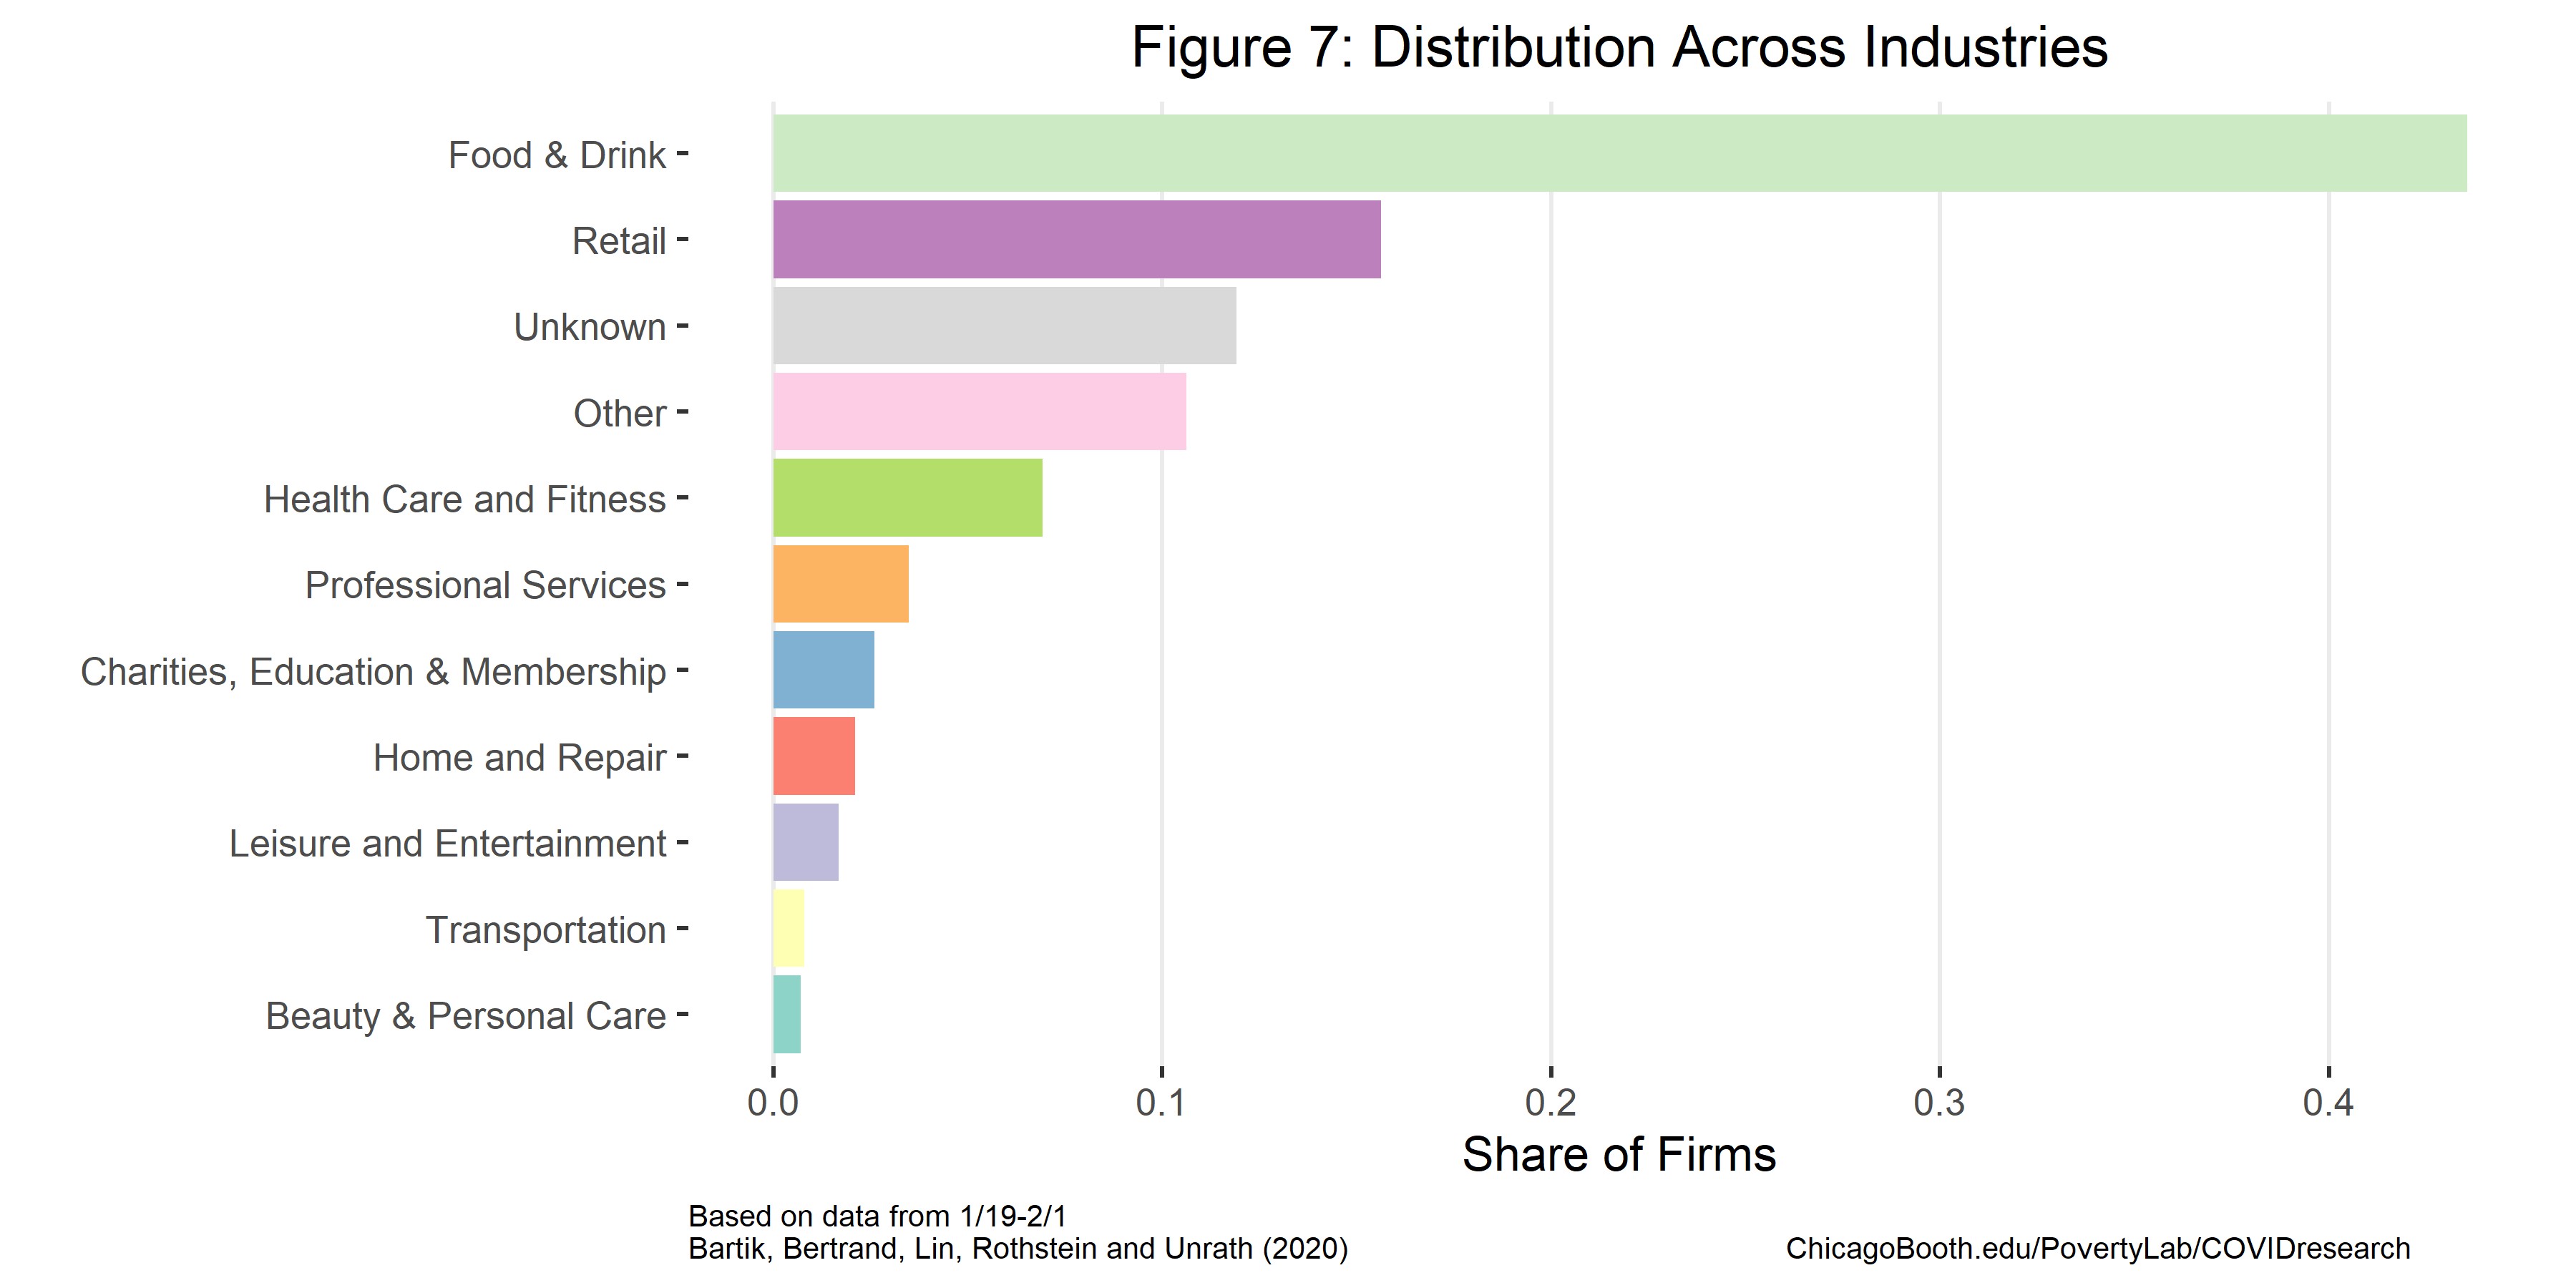
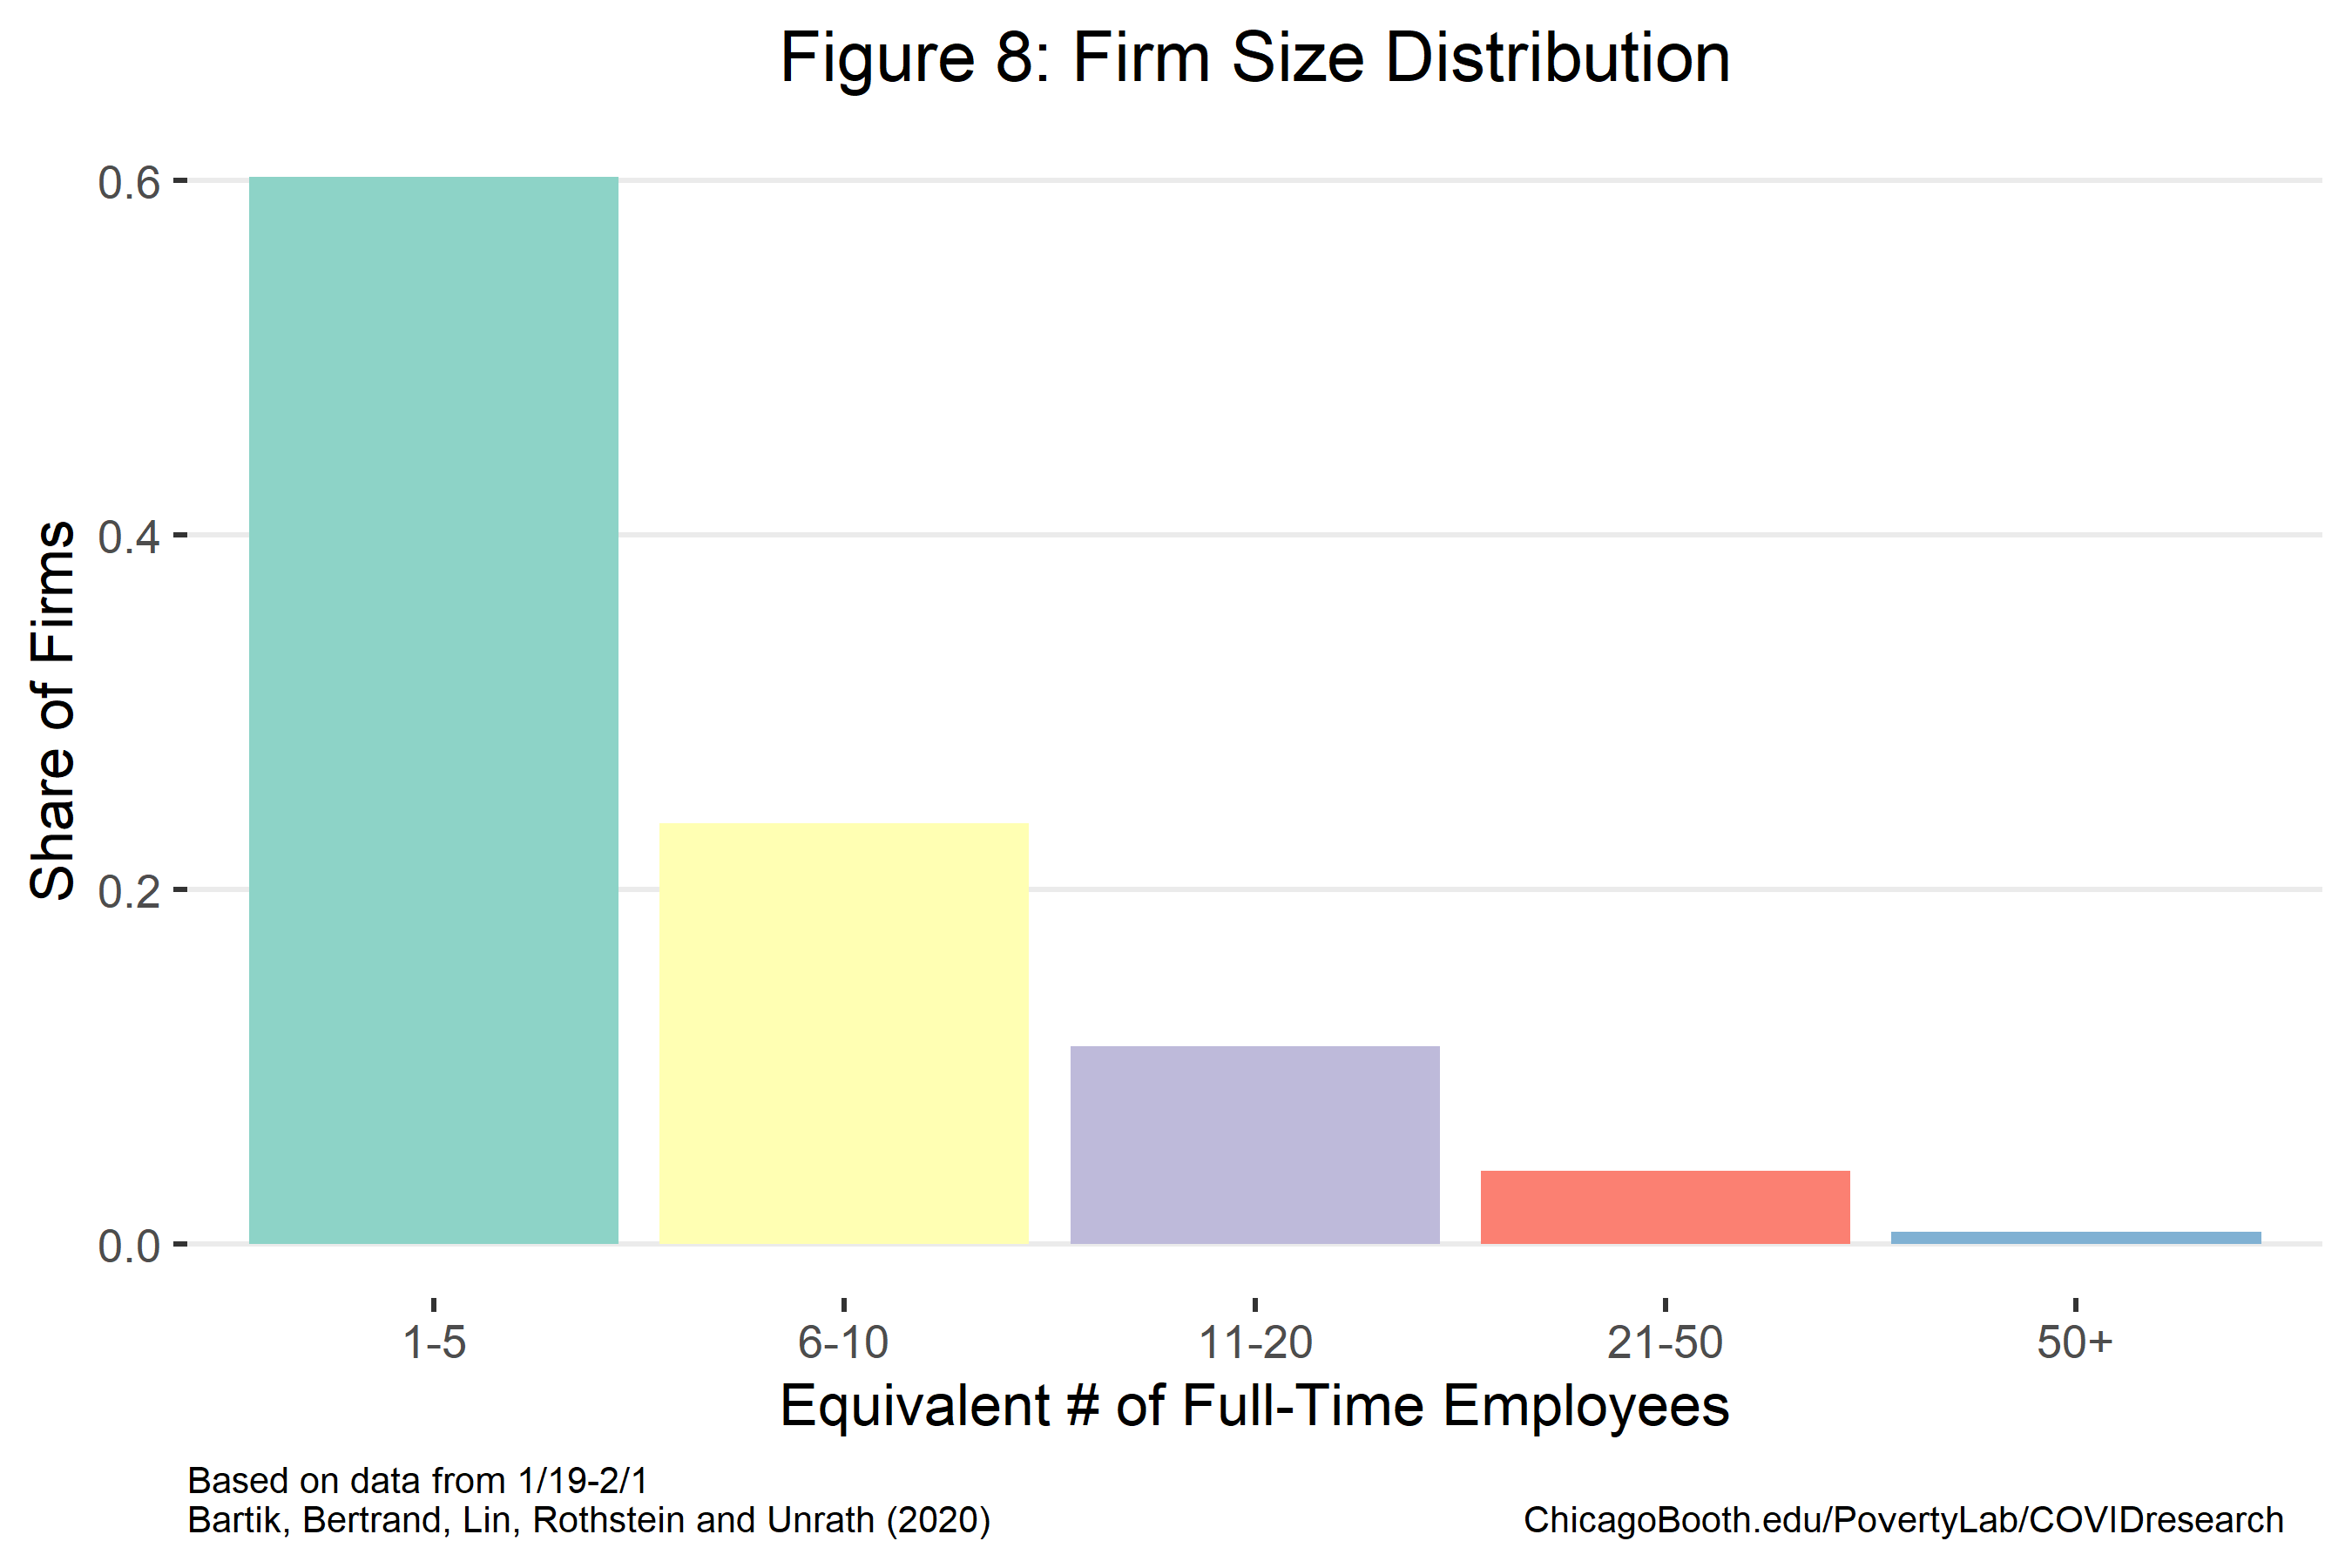
Figure 8: Almost All Homebase Firms Have 50 Full-Time Equivalent Employees or Less
This figure shows the share of Homebase firms in each of five size categories. We define categories based on the number of hours worked at the firm between January 19 and February 1st, which we convert to full-time equivalent (FTE) workers by dividing by 40 hours per week. Roughly 60 percent of Homebase firms have one to five FTE employees (i.e., less than 400 hours worked in our two base period) and the vast majority have fifty or fewer FTE employees.
Methodology
Our analyses are based on data on hours worked at the establishment-worker-day level generously made available by Homebase. These data extend from January 1, 2020 through March 28, 2020. We aggregate the Homebase data to the firm-MSA-industry-day level. We restrict the sample to firms whose employees worked at least 80 hours between January 19 and February 1 and to states for which we observe at least 50 such firms. We refer to this two-week window as the “base period.” All analyses weight firms by their total hours during the base period.
In our analyses of weekly outcomes (e.g., Figures 1 and 4), we normalize each firm’s hours by dividing by the average hours worked per week over the base period at the firm. In our analyses of daily outcomes (e.g. Figures 2 and 3), we normalize by dividing by the average value of the outcome at the given firm on the same day of the week during our base period. For example, if total hours for a firm on Friday, March 13 was 100 and total hours for the same firm on Friday, January 24 and Friday, January 31 was 300, (150 on each day), the outcome variable total hours’ value would be .66. (This is 100 divided by (300/2), the average Friday hours in the base period.)
We use the data compiled by The New York Times on the timing of stay-at-home and shelter-in-place orders in different states.
Authors
Alexander W. Bartik, Assistant Professor Economics, University of Illinois at Urbana-Champaign, and Research Affiliate, UChicago’s Poverty Lab
Marianne Bertrand, Chris P. Dialynas Distinguished Service Professor of Economics, University of Chicago Booth School of Business, and Faculty Director, Chicago Booth’s Rustandy Center for Social Sector Innovation and UChicago’s Poverty Lab
Feng Lin, Research Professional, Chicago Booth
Jesse Rothstein, Professor of Public Policy and Economics, University of California, Berkeley, and Director, Institute for Research on Labor and Employment (IRLE) and California Policy Lab
Matt Unrath, PhD Candidate, Goldman School of Public Policy, UC Berkeley, and Research Fellow, California Policy Lab
Acknowledgments
We thank Homebase and Ray Sandza in particular for generously allowing access to their data and sharing their time to answer questions and help us understand the data. We also thank Jingwei Maggie Li, Salma Nassar, and Greg Saldutte at Booth’s Rustandy Center for Social Sector Innovation and Manal Saleh at the Poverty Lab for excellent assistance on this project and Michael Stepner for comments.