

Recovery from the Great Recession has been slow and extremely prolonged. It was tempting to conclude, at various points, that we had recovered as much as we were going to. Even after the official unemployment rate receded, other indicators of recovery remained much more mixed—the share of people employed remained well below pre-recession levels; wages were stagnant; and inequality continued to grow. Absent clear evidence of a full recovery, including healthy wage growth, policy efforts should emphasize ensuring that the benefits of growth are broadly shared.
Overview
From December 2007 until June 2009, the U.S. experienced one of the worst economic downturns in its history: real GDP dropped 5 percent, the economy lost millions of jobs, and the unemployment rate more than doubled, reaching 10 percent. Recovery from this was very slow: While the U.S. economy has added jobs every month since September 2010 and GDP growth has been steady at roughly 2.2 percent per year, the share of the population that is employed has yet to fully recover ten years after the end of the recession. Indeed, the general pattern in the labor market has been rising inequality, inadequate labor demand for many years, and stagnating wages for working- and middle-class workers.
While there is general agreement that the recovery has left many workers behind, there is not a clear consensus about how to reconcile the poor outcomes with strong growth and a historically low unemployment rate. With the expansion now older than the previous post-war record, it has been tempting at various points to conclude that the recovery was complete, and that whatever weakness remained in the labor market was the “new normal.” Each time that people have drawn this conclusion to date, however, it has been quickly falsified, as conditions continued their slow improvement. Had we accepted the conclusion, we might have taken steps to slow the economy (e.g., through tighter monetary policy), but this would have been premature, and would have cut off opportunities for workers to recover their lost ground.
This policy brief reviews IRLE research on the recession’s long-lasting impact on wages and employment for American workers, with an eye to what that research says about the current state of the economy. While any study of contemporaneous conditions is quickly dated, the identification of an error made repeatedly can be a warning to avoid repeating it. It is clear that we do not have good real-time measures of whether we are at full employment. Absent those, we should be very cautious about cutting off an opportunity for additional recovery.
What has recovery looked like?
On the face of it, the labor market appears to have fully recovered from the recession. The unemployment rate—the most commonly-cited economic statistic, measuring the percentage of people in the labor force who do not have any employment—has been at or under 4.0 percent for nearly a year, and under 6.0 percent for over four years.1 Monthly jobs reports show a 101-month streak of gains.2 But job growth and wage adjustments have been underwhelming, especially in comparison to pre-recession levels, until much more recently.
In a 2017 paper, IRLE Director Jesse Rothstein analyzed the state of the labor market as of 2014.3 In December 2014, the unemployment rate was 5.6 percent, below what many would have said was a level consistent with full employment. Had the expansion run its course? Was it time for the Federal Reserve to put on the brakes, lest we set off an inflationary spiral? Rothstein’s evidence indicated that these conclusions would have been quite premature. He found no evidence of wage pressure consistent with full employment. The labor market had not reached a “new normal,” but remained deep in the trough that it fell into during the Great Recession. There was still more room to recover.
Fortunately, policymakers did not take steps at the time to tighten the economy, and the market has continued its slow recovery for another four years. While it is logically possible that we have now at last reached full employment, Rothstein’s findings, and our experience since, are an important lesson about the costs of premature tightening, and have critical implications for what policymakers should conclude about the state of the economy moving forward.
Recovery has been long and uneven
As shown in Figure 1, the unemployment rate has fallen steadily since the end of the recession. It fell under 4 percent in early 2018 and has remained there since, at a level not seen since the late 1960s.4 But it took a long time to get to this point. Five years after the Great Recession was declared over, unemployment was higher than in 2007 (pre-recession).
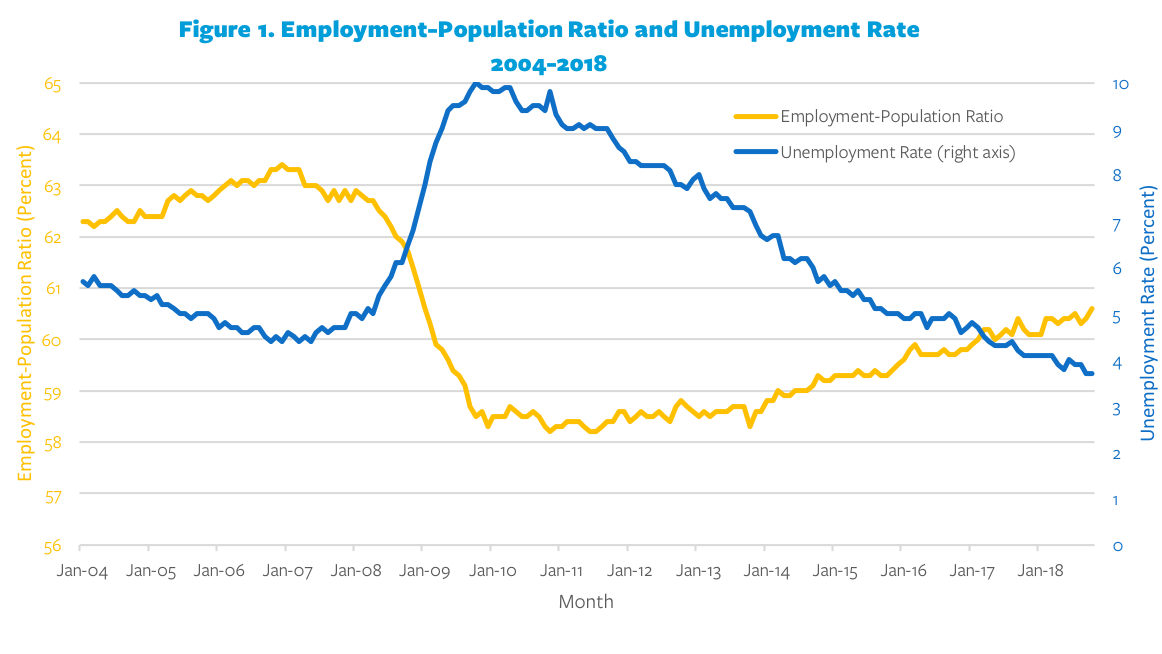
By 2017, the unemployment rate fell below its pre-recession level.5 By April 2018, there were more job openings than officially unemployed workers.6 It appeared to some as if there was no more room for the labor market to recover. But this actually proved to be overly pessimistic. Since April 2018, the economy has added more than 2 million jobs.7 How did this happen? There was a large pool of additional workers, not counted as unemployed, who were available to work with sufficient labor demand. These were workers who had left the labor force, abandoning their job searches in many cases because they were unable to find work.
An alternative measure of labor force utilization is the employment-to-population ratio, the share of the working-age population who are currently working, regardless of whether they are actively searching for work (as is required to be counted as unemployed). This measure fell nearly five percentage points during the recession. It barely recovered through early 2014, but has been gradually creeping back since then (Figure 1). The recovery has been much slower than for the unemployment rate, however. Even in 2019, the employment-to-population ratio remains well below its pre-recession level.
Little sign of structural change
Those inclined to see the labor market as having reached a “new normal” several years ago, with employment rates still low, often argued that structural changes in the labor market had reduced potential employment. For example, technological change during the recession might have favored more skilled workers, such that even a robust economy would not create enough jobs for those with lower skills. Alternatively, geographic mismatch could limit recovery, if unemployed workers were stuck in declining locations, far from the dynamic markets where jobs were being created.
To investigate this, Rothstein explored the evidence for unevenness of the downturn and subsequent recovery. Employment loss varied by industry: the worst job losses during the Great Recession were in construction and durable goods manufacturing. But after the recession, employment grew in all major private sector industries, and grew fastest in those that had lost the most jobs. There were only a few sectors in which net employment growth between 2007 and 2014 (spanning the recession) kept pace with the growth of the working-age population: mining, logging, professional and business services, education, health and social assistance, arts and recreation, and food and lodging.
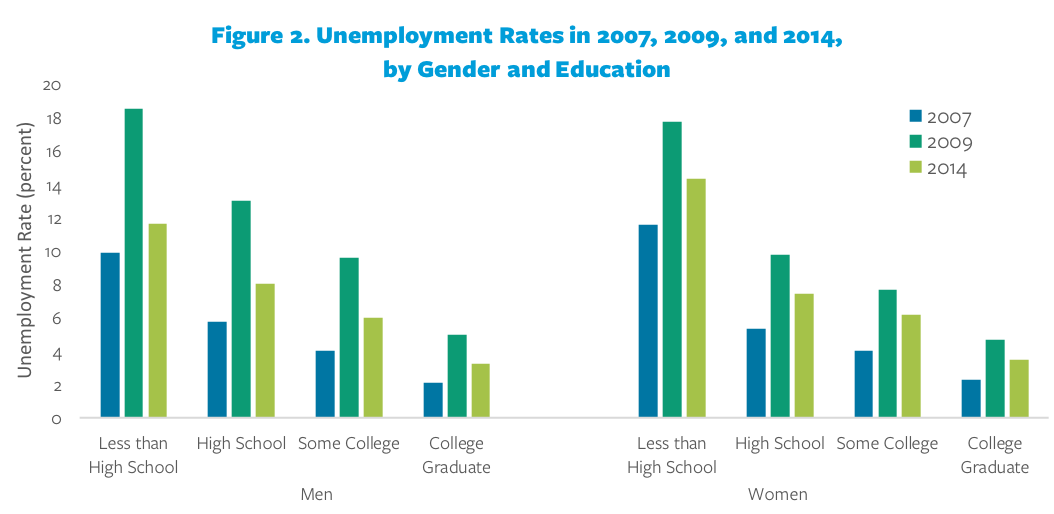
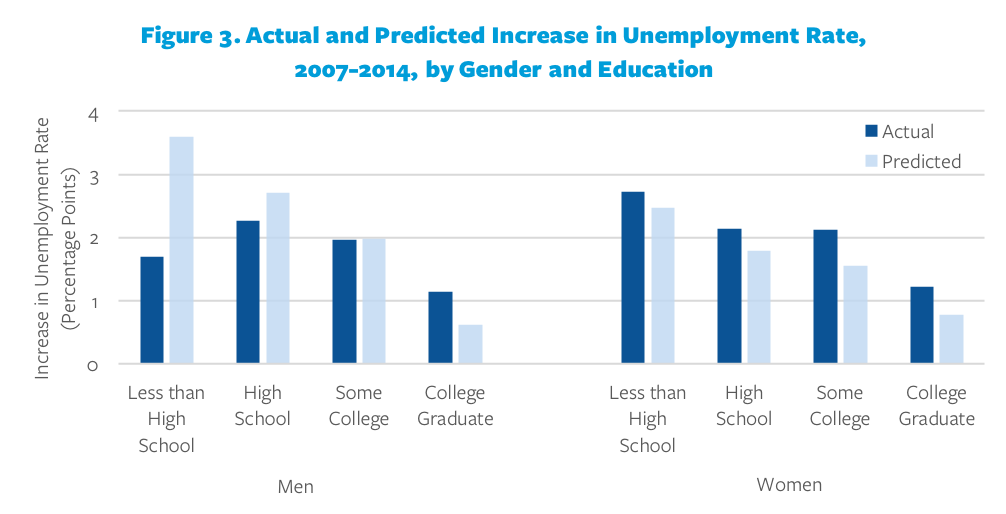
Comparisons across demographic groups are similar. As with industries, the recession affected different groups differently, but the recovery tended to make up these differences, and all groups were doing less well in 2014 than before the recession (see Figure 2). Overall, labor demand recovery following the recession was actually skewed in favor of less skilled men, and against those with college degrees (see Figure 3). This is not what one would have expected had technological change disproportionately benefitted the most educated.
Finally, only seven states had 2014 unemployment rates below their 2007 levels, and unemployment remained higher than it was before the recession in more than 90 percent of metropolitan areas.
Rothstein argued that the simplest explanation for the pattern of data points as of 2014 was that the labor market was not approaching a full but uneven recovery, but was still suffering from the aftermath of one of the severest shocks to the economy on record. Labor demand remained weak for nearly all types of workers, regardless of skill level, gender, age, or industry. Unfilled job openings were most likely explained by employers being pickier among job applicants, raising the required qualifications, and offering lower wages to new hires.
Stagnant wages
Rothstein proposed a simple test: A tight labor market, with employers truly struggling to fill jobs, should produce rapid wage growth, as employers bid up wages to attract the workers they need. We saw this in the late 1990s, the last truly tight labor market. But as of 2014—and much more recently than that—there was no sign of it in the post-recession labor market. Wages were largely flat between 2002 and 2014.
This stagnation was broadly shared: Wages stagnated across education, gender, age, and industrial sector, with no evidence of faster wage growth in industries with higher growth in job openings or in metropolitan areas with lower unemployment rates.
Either the labor market was not as tight as it appeared or some other force (such as monopsony power in the labor market) was keeping wages down. In either case, there was evidently substantial room remaining for further demand growth without risking a wage-price spiral and runaway inflation. This judgment has been borne out by the experience of the last four years: Employment has grown (and the unemployment rate has continued to fall) with little sign of wage pressure. While wages have grown modestly, there is still substantial lost ground to recover.
Since 2014, there have been signs of resurgence. After growing at a less than 2 percent rate in 2010-2014, wages have been growing at a 3 to 3.5 percent rate since. This is a sign that the market is finally tightening, and that employers are beginning to offer higher wages in order to attract and retain workers. But much more labor market tightening is necessary to make up for the low growth averages over the last ten years.
California: deeper recession, stronger recovery
How did the recession affect California, the world’s fifth-largest economy and one of the hardest-hit states?8 Labor economist Sylvia Allegretto compares employment and wage changes in California to the rest of the U.S. from June 2009 to March 2018, using data from the Bureau of Labor Statistics.9
California’s job growth outpaces the U.S.
Job growth in California has outpaced the national average in nearly every sector. California experienced 18 percent overall job growth since the start of the recovery compared to 13 percent nationwide. However, California lost a greater share of its jobs (1.3 million) than the U.S. (8.7 million) during the Great Recession, and it took over six years to recover from these losses. As in the U.S. as whole, private sector job growth has far outpaced growth in the public sector, with California outpacing the national average in increases of private sector jobs. The U.S. has lost public sector jobs at the federal, state, and local levels, but California has seen a slight bump in state and local public sector employment.
On the surface this looks like good news for California, but job growth varies widely by industry and metropolitan area. The health services industry, leisure and hospitality, and professional and business services in California have had the strongest job gains in the private sector, while natural resources and mining, construction, and manufacturing have experienced deep job losses. Despite California’s positive job growth in the public sector, when comparing the number of public jobs needed to serve the state’s population, Allegretto found a 157,200 job gap, most of which can be attributed to the state’s teacher shortage.
Long-term joblessness and underemployment
While the jobs recovery looks somewhat positive for California as a whole, the recession hit the state’s workforce hard. Unemployment rates in California were higher than the national average during the recession, and stayed in the double digits for 43 consecutive months. In 23 California counties, particularly those in the Central Valley, unemployment reached between 15-29 percent in 2010. Unemployment during the recession also varied greatly by race/ethnicity. While the worst rate of unemployment for whites and Asians was roughly 10 percent in 2010, Latinos experienced 14.7 percent unemployment in 2009 and African Americans experienced nearly 20 percent unemployment in 2011.
As of 2017, California’s unemployment rate looked promising at roughly 4.5 percent,10 but long-term unemployment (those who have been unemployed for 27 weeks or more) remained much higher (24.9% in 2017) than the pre-recession rate in 2007 (16.8%). Underemployment, which is a measure of discouraged and marginally attached workers, part-time workers looking for full-time work, and those who gave up the job search, has been consistently higher in California than the U.S. over the last decade. California would have an additional 1.1 million workers today if the employment rate was the same as it was in 2007 before the recession.
Californians face stagnant incomes and poverty
Wages in California have grown fastest for earners at the top of the income distribution. Wages for those in the bottom- and middle-income earners remained stagnant up until the recession and dropped until about 2014. As in the national data, low- and median-wage workers in California finally experienced wage growth that outpaced inflation starting in 2014. This was in part due to labor market tightening, but also due to state and local increases of the minimum wage.
Income for the median household has remained relatively flat in California, rising only 1.2 percent over the last decade. The gap between productivity growth and household income stagnation has been particularly stark in California, where productivity grew 19 times faster than median compensation (compared to 5.1 times for the U.S.) from 1979 to 2016.
Californians are also poor relative to the U.S.: by the official poverty measure, California ranked 15th highest in 2016. However, when taking into account other variables such as cost of living, taxes paid or credited, medical expenses and child support, the state’s poverty rate is highest in the country.
What it means for California’s economy
Allegretto’s research suggests that recovery is incomplete; that several measures of the labor market indicate that there is still room for improvement and this is not the “new normal.” She dispels popular fears about the impact of robots and the gig economy; in fact, new technologies have not structurally changed the economy (although they have enabled companies to skirt the traditional employer relationship).
Recommendations
Both Rothstein and Allegretto argue that a slow recovery from the recession is still driving weak labor demand and wage stagnation. Workers across all industries and education levels have experienced weaker labor demand than they did before the onset of the Great Recession, and the recession hit workers in some states especially hard.
If the weak recovery is a cyclical feature—reflecting the deep nature of the downturn rather than a fundamental change in the economy—then it is important that policy allow it to run its course, rather than cutting it off out of fears of incipient inflation. The Federal Reserve should be extremely cautious in tightening monetary policy. As Rothstein notes, there have been voices throughout the slow recovery calling for the Fed to apply the brakes; it would have been a mistake to do so earlier, and even today there is little evidence of substantial risks from allowing the economy to continue to recover.
Other policy implications relate to the extremely deep recession and the extreme duration of the recovery. We need to put in place policies that will help workers who suffer from weak labor demand and extended downturns. These could include expanded higher education and job training programs, much more aggressive fiscal stimulus, and perhaps even public jobs programs to provide work when the private market does not.
Finally, in the absence of sustained strong labor demand, we need policies to raise wages. Much of the growth we have seen in the last few years, especially at the lower end of the wage distribution, is due to state and local minimum wage increases, and more may be needed. Strengthened worker bargaining power, via better collective bargaining rules, would also help ensure that workers see the benefits of rising productivity, even when the market is not tight enough to force this on employers.
FEATURED RESEARCH
Allegretto, S.A. (2018). A post-Great Recession overview of labor market trends in the United States and California. Center on Wage and Employment Dynamics. Retrieved from http://irle.dream.press/files/2018/06/A-post-Great-Recession-overview-of-labor-market-trends-in-the-US-and-CA.pdf.
Rothstein, J. (2017). The Great Recession and its aftermath: What role for structural changes? RSF: The Russell Sage Foundation Journal of the Social Sciences 3(3): 22-49.
ABOUT THIS SERIES
This is the third in a series of policy briefs featuring IRLE faculty research on the Great Recession. The first brief explored the causes of the Great Recession. The second reviewed the impact the recession had on families and the effectiveness of the social safety net.
ABOUT IRLE’S POLICY BRIEF SERIES
IRLE’s mission is to support rigorous scholarship on labor and employment at UC Berkeley by conducting and disseminating policy-relevant and socially-engaged research. Our Policy Brief series translates academic research by UC Berkeley faculty and affiliated scholars for policymakers, journalists, and the public. To view this brief and others in the series, visit irle.dream.press/policy-briefs/
Series editor: Sara Hinkley, Associate Director of IRLE
References
- Bureau of Labor Statistics. (2019). Labor force statistics from the Current Population Survey. Retrieved from https://data.bls.gov/timeseries/LNS14000000.
- Bureau of Labor Statistics. (2019). Employment, Hours, and Earnings from the Current Employment Statistics survey (National). Retrieved from Retrieved from https://data.bls.gov/timeseries/ces0000000001.
- Rothstein, J. (2017). The Great Recession and its aftermath: What role for structural changes? RSF: The Russell Sage Foundation Journal of the Social Sciences 3(3): 22-49.
- Bureau of Labor Statistics. (2019). Labor force statistics from the Current Population Survey. Retrieved from https://data.bls.gov/timeseries/LNS14000000.
- Ibid.
- Folley, A. (2018, June 5). There are now more job openings than unemployed workers in the US. The Hill. Retrieved from https://thehill.com/policy/finance/390869-there-is-now-more-than-one-job-opening-per-one-unemployed-worker-in-the-us.
- Bureau of Labor Statistics. (2019). Employment, Hours, and Earnings from the Current Employment Statistics survey (National). Retrieved from https://data.bls.gov/timeseries/ces0000000001.
- Associated Press. (2018, May 4). California is now the world’s fifth-largest economy, surpassing United Kingdom. Los Angeles Times. Retrieved from http://www.latimes.com/business/la-fi-california-economy-gdp-20180504-story.html.
- Allegretto, S.A. (2018). A post-Great Recession overview of labor market trends in the United States and California. Center on Wage and Employment Dynamics. Retrieved from http://irle.dream.press/files/2018/06/A-post-Great-Recession-overview-of-labor-market-trends-in-the-US-and-CA.pdf.
- State of California Employment Development Department. (2018, November 16). Monthly Labor Force Data for Counties: October 2018. Retrieved from https://www.labormarketinfo.edd.ca.gov/file/lfmonth/countyur-400c.pdf.